
I have never understood the infatuation with randomness. When I was first introduced to statistics at a very young age, I had a hard time at first trying to comprehend the paradigm in my own intuitive fashion. It seemed like something was off about it, where random chance was the cornerstone of a philosophy trying to describe and predict a decidedly non-random world. Rolling dice makes sense in the context of a board game.
It started in finance, going all the way back to Louis Bachelier’s Théorie de la Spéculation from 1900. He wrote, “there is no useful information contained in historical price movements of securities.” Essentially, he contended, markets start over every single day with new information that in every way supersedes and replaces any and all information obtained yesterday.
If that was to be applied to financial markets correctly, then this random walk might also apply to the economy. What is an economy after all but the exchange of goods and services, massive if informal marketplaces spread all throughout the system. In Robert Merton’s 1997 Nobel Prize lecture, one that he gave before LTCM would fail, he said:
Thus, I felt that working in economics could ‘really matter’ and that potentially one could affect millions of people. I also believed that my mathematics and engineering training might give me some advantage in analyzing complex situations. Most important in my decision was the sense that I had a much better intuition and ‘feel’ into economic matters than physical ones.
Intuition and “feel” are non-random variables, so I have often wondered if that was intentional irony on Merton’s part, or whether it was mere arrogance. Either way, as LTCM showed, economists who are really statisticians have realized that there are enormous shortcomings even at the basic level of the random walk. That is why they run tens of thousands of simulations in order to try to model and predict “central tendencies”, because often (meaning always) what happened yesterday bears enormous weight on what happens today. There can’t be mean reversion if you really don’t know what the mean is.
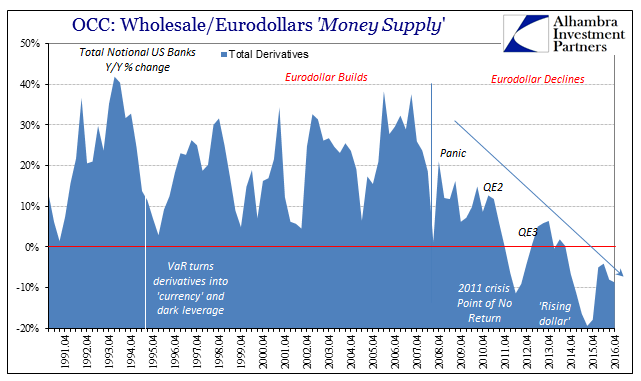
I wrote almost exactly six years ago just before the outbreak of the 2011 crisis:
Despite the woeful track record of statistical modeling, it still forms the basis of most people’s investment and economic risk assessments. Market standard deviations and risk measures are again relatively low and investor complacency has returned. The economic recovery is still assumed to be in progress and inflation is “transitory” because the math says monetary policy works. There is no chance that the dollar gets replaced as a reserve currency because it has never happened before. The global financial and trade system will not experience a dramatic re-adjustment because it is not a part of any time series data…
As the economic recovery slows again, we are again told by the Fed and mainstream economists not to worry. Behind those reassurances is the embedded weakness of modern arithmetic adherence and the ironic, illogical hubris it breeds.
I bring all this up in the context of revisions season. As the stock market has its quarterly earnings season, so does the economy hold an annual period of benchmark revisions; though in the interest of precision, the economy does nothing different for it is statistics that have to be updated in order to more fully describe non-random occurrences. For many people, it may seem overly pedantic to spend any time writing about statistical revisions to various accounts often several years afterward. What bearing does the refiguring of 2015 Factory Orders have on the economy and markets of 2017?
Take for example September 2015. In early November 2015, the Commerce Department under benchmarks prepared in June that year estimated Factory Orders for the month of September to have been around $487 billion. That was 7% less than what was figured for September 2014, a significant decline that indicated more than run-of-the-mill manufacturing weakness. This was a recession-level contraction.
Two benchmarks later, the latest released today, Factory Orders for September 2015 are now believed to have contracted by 8.7%. That may seem, again, more trivia than anything, but it doesn’t fully describe the changes. Using the June 2015 benchmarks, the estimate for Factory Orders in September 2014 was $524 billion. The latest benchmark estimates leave for September 2015 just $467 billion. Not only was the contraction slightly more in that one year comparison, the whole one-year comparison was itself contained in a reduced economic state, the latter part being far more important. There was marginally less economy spread out over several years.
The level of activity in 2014 was somewhat less, and the subsequent activity in 2015 also somewhat less. A weaker economic state than what was first believed is relevant to understanding why the economy remains weak in 2017 rather than like all historical precedence having sprung back to life. To more fully understand why that hasn’t happened today, we need a full accounting of yesterday because in the real world these things matter.
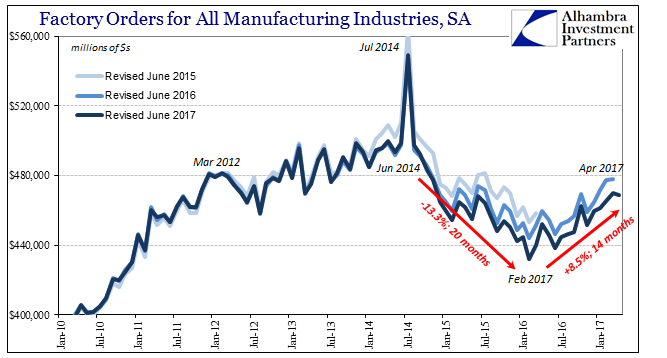
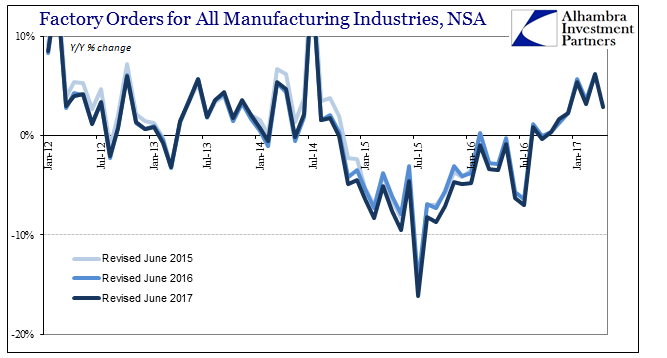
For April 2017, Factory Orders are estimated to have risen by just 2.9% year-over-year (NSA). That follows growth in March of 6.2%, which had been the highest in some time. Like everything else, though, it follows more so the trend of oil prices rather than indicate economic momentum, while also confirming that monthly anomalies are always those on the high side (and 6.2% is not much of a “high” side).
For the four months of 2017 combined, Factory Orders are up just 4.4% over the same months in 2016. Having suffered a contraction of more than a year, nearly two years, 4.4% is itself a continuation of that non-linear contraction.
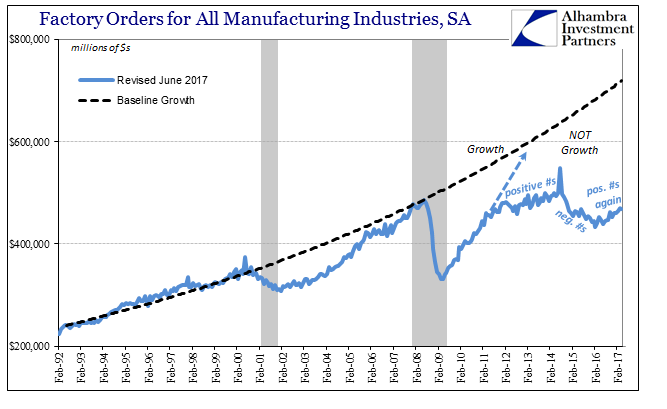
To be even a little further away from true growth levels is meaningful for interpreting why the economy never seems able to generate momentum unlike all prior history (except the 1930’s). In other words, it describes more comprehensively a different economic paradigm than the one (nearly) everyone had been expecting. Therefore it is nothing random to suggest weakness will (can) only continue, especially as it conforms that much more to the post-2011 “dollar” system.
Factory orders, seasonally-adjusted, in April 2017 are barely more than what they were in July 2011 (and less than November 2011). There have been officially no declared recessions in between, which means there are no declared cyclical explanations for that enormous disparity. The contractionary period starting in 2014 was a significant factor in leaving the manufacturing sector in such a precarious state. It doesn’t seem like much, but these small things add up in statistics as representing the real economy. Six years of no growth, and the depths of the two years of contraction within, is germane to everything about 2017.
Stay In Touch