
What is most tragically ironic about the last decade is that the people who are supposed to have been in charge are the same people claiming it could never happen. Ben Bernanke, for example, made his career on studying the Great Depression. Using Milton Friedman’s brand of primitive monetarism as a base, he and others like him developed the modern central bank based on analysis of all the grave mistakes made primarily by monetary authorities in the 1930’s (updated with further opposite mistakes made in the 1970’s).
But in starting with Friedman, it is quite apparent they never really listened to him. Economists like Bernanke, Alan Greenspan, or Janet Yellen don’t get the bond market. It’s a problem because they really should given their self-assigned responsibilities, and more than that bonds describe fundamentals better than anything else. Next to every complex and elegant DSGE model ever invented, the simple yield curve is beyond compare.
In 1987, Ohio State economist Stephen Cecchetti wrote a paper for the NBER examining other characteristics of US Treasury rates during the 1930’s. Nominal rates were not exclusively determined by the outlook for growth and inflation, rather there was great value leftover at maturity. Because of the US deficit situation throughout the decade, the US Treasury Department offered what Cecchetti called an “exchange privilege” that at many times proved quite valuable.
Without a developed primary dealer system, Treasury legally bound to auction debt at par would often (almost always) increase the coupon above what would be a market par price in order to entice full bidding and a smooth floatation. Holders of expiring bonds were given an option to take part in this money-making opportunity.
Cecchetti’s work is noteworthy in that he statistically redrew nominal UST rates for the 1930’s and 1940’s to extract that “exchange privilege”, leaving us with a more pristine yield curve for economic analysis.
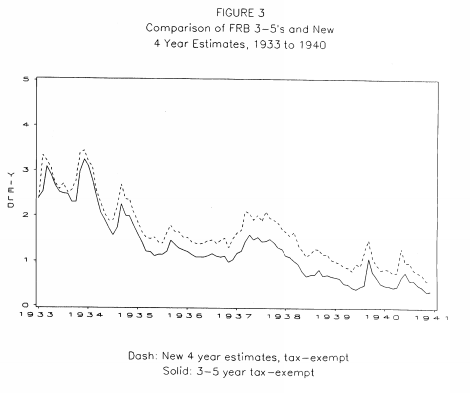
In truth, nominal rates didn’t change all that much, often shifted upward by at most tens of basis points and never altering the trajectory of interest rates during the Great Depression and following war years. The yield curve history in either case shows us perhaps too much that is familiar.
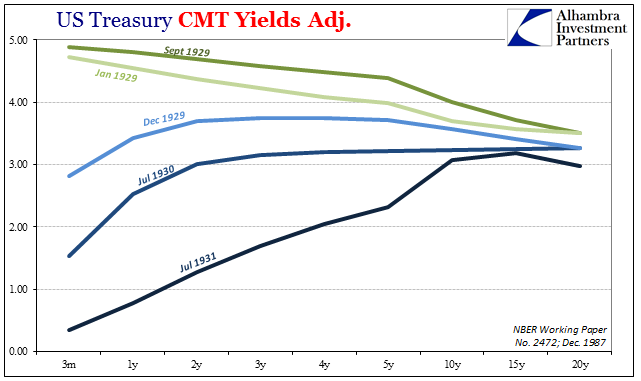
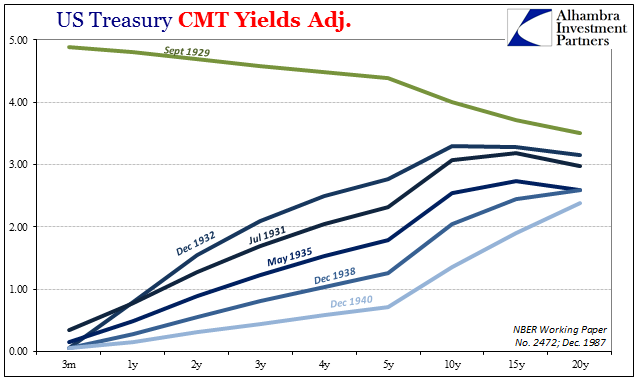
Using Cecchetti’s estimates for adjusted UST yields, the yield curve starting in 1929 was already inverted long before the crash that October. Then, as is typical in forming recession, the yield curve steepened dramatically as the front end bottomed out once liquidity risks were widely feared and largely financial participants sought dramatically those characteristics.
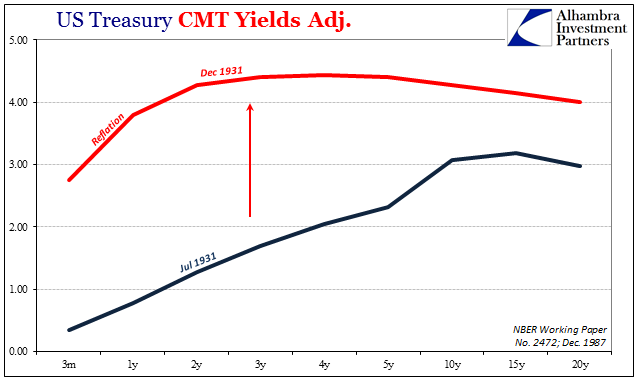
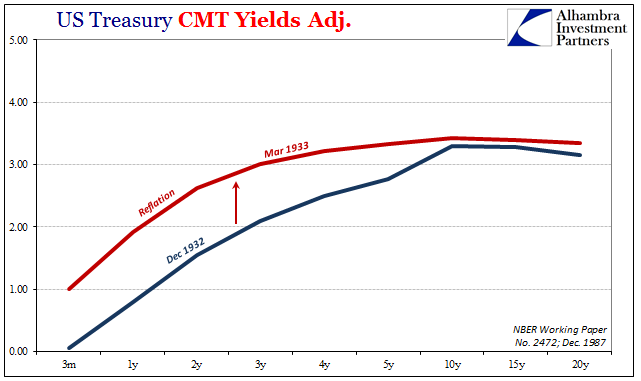
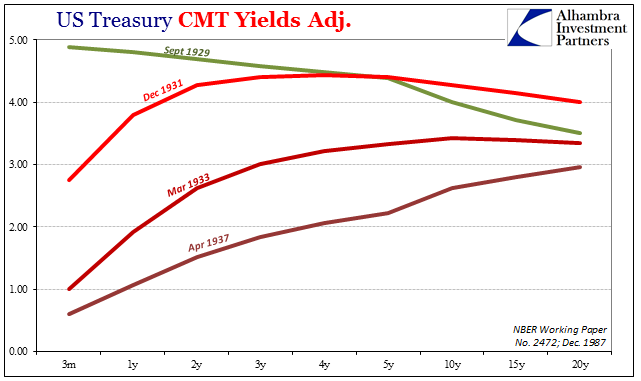
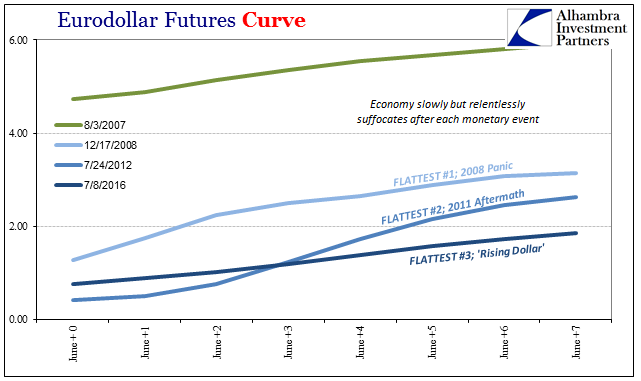
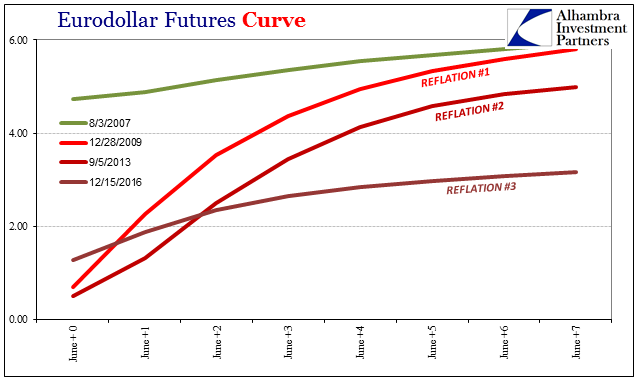
What followed, however, was this back and forth between hope and crisis all throughout the whole of that decade. After the first liquidity event in 1931, there was tremendous hope that was it, the very worst was put to history. The yield curve drove upward and flattened in what today we might call “reflation.”
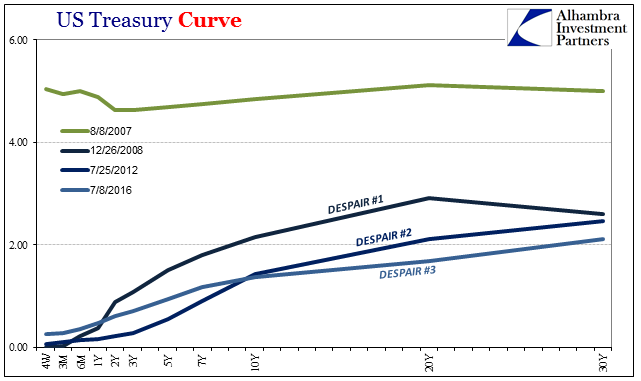
But that was instead followed by another liquidity event (leading to another wave of bank panics) that drove the curve flat and lower all over again. Back and forth the yield curve would traverse, alternating between periods of hope and despair.
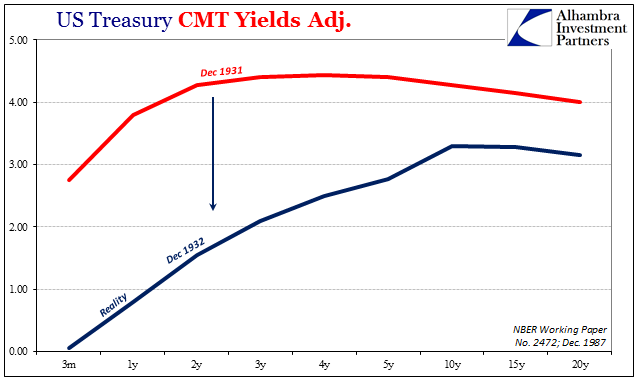
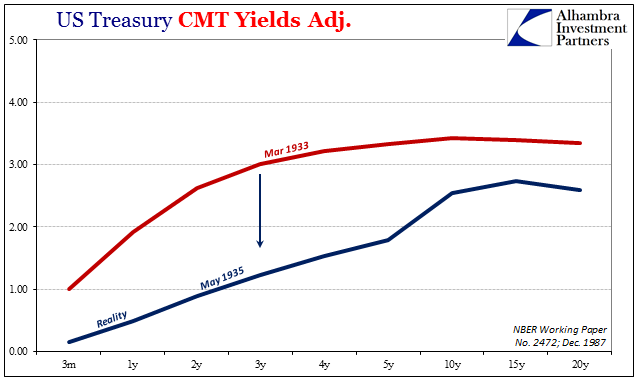
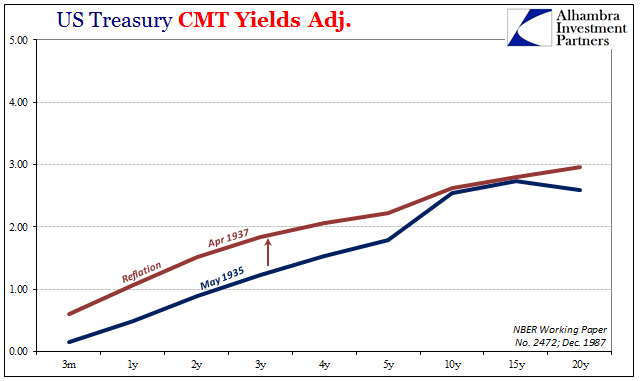
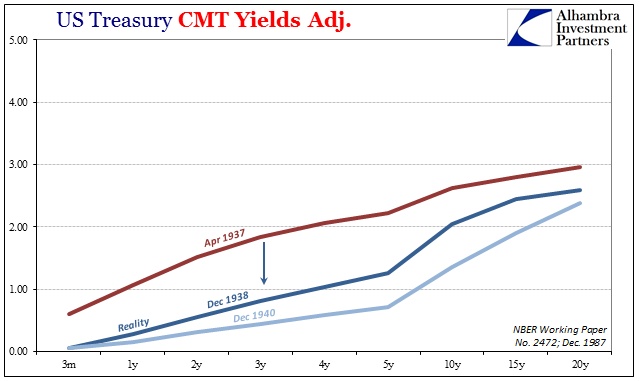
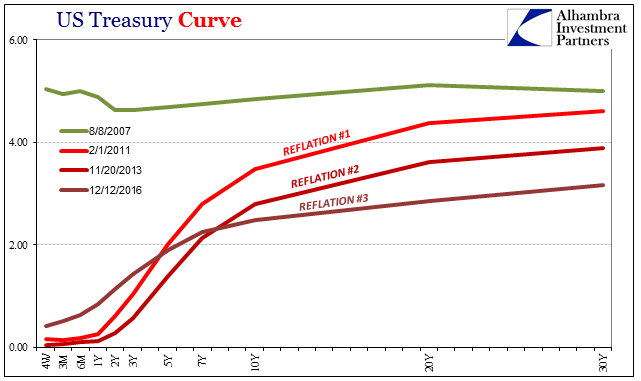
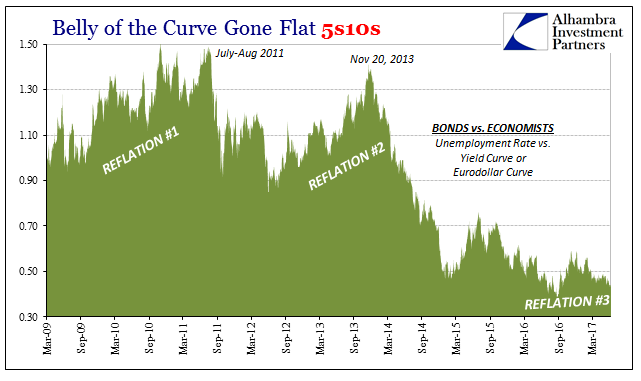
The net result for all the ups and downs was incrementally weaker “reflation” curves followed by lower and flatter bottoms. Despair won. The trajectory of such “lower highs” and “lower lows” is what should be quite familiar, and therefore germane to the economic as well as liquidity perceptions of the current bond market and its UST curve.
This pattern is repeated importantly in eurodollar futures, as well.
Back in the middle 1930’s, just as today, officials and economists were convinced that interest rates had nowhere to go but up. So worried was the Treasury Department, it actually had the Federal Reserve intervene on more than one occasion.
As the economy seemed to recover from the depths in 1932 and early 1933, that is precisely what concerned officials. In the spring of 1935, Treasury representatives held several conversations with their counterparts at the Federal Reserve aimed at convincing the latter group to buy UST securities. It presented its case as proposed policy to stabilize the government bond market for whatever risks. In the conditions of 1935, that meant what they were increasingly sure was latent inflation pressures building up underneath.
The similarities are remarkable, particularly in this “reflation” view. It proves, I suppose, irresistible because of human nature; again the belief that lack of full recovery is somehow impossible. At some point after so many years, “we” believe recovery just has to kick in if for no other reason than luck, and therefore amplify whatever small positive indication into the convincing proof it never was. Belief in authorities certainly plays a role, but as the history of all these curves really shows, that belief isn’t permanent. The longer it goes without recovery, the lower curves drop in each cycle, meaning the more jaded (for every good reason) these markets become. It is not so much despair vs. reflation or hope, rather it’s making peace with reality.
To today’s policymakers, the yield curve as well as eurodollar futures are some kind of mystery. They aren’t. They simply prove that these people who claimed to have studied all the necessary facets of the Great Depression didn’t actually do that. How else could 2008 have happened, let alone the aftermath? They surely didn’t listen to Friedman.
As an empirical matter, low interest rates are a sign that monetary policy has been tight, in the sense that the quantity of money has grown slowly; high interest rates are a sign that monetary policy has been easy in the sense that the quantity of money has grown rapidly. The broadest facts of experience run in precisely the opposite direction from that which the financial community and academic economists have all generally taken for granted.
Stay In Touch