
For such an important set of data, the PCE stuff continues to suggest a whole lot of capriciousness. There has been a tendency to drastically revise figures such that they change not in the small ways regular revisions are supposed to produce. The whole purpose of especially benchmark revisions is to calculate a more accurate number. In the past few years, it has been to rewrite history if only to confirm the negative case long afterward.
The Personal Savings Rate is just such an important concept. It can tell us a great deal about consumer behavior in a forward-looking manner. If the savings rate falls while growth or output accelerates, it may suggest consumers embracing the boom. Should it fall in tandem with output, it could be that Americans are exhausting themselves badly in need of labor market growth in wages and incomes.
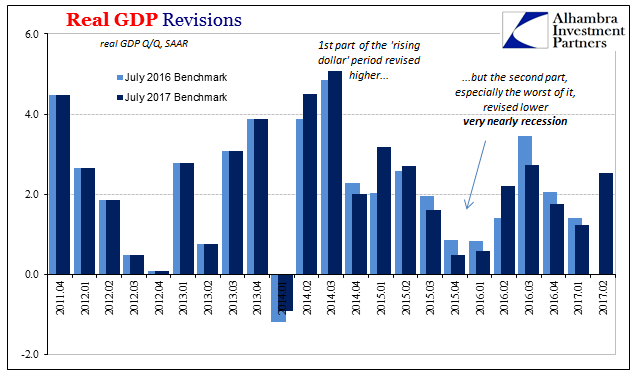
The primary statistical problem with the savings rate is that it is the difference between two other series that have a tendency to undergo significant revisions at time intervals more than just annual benchmarks. For PCE data and related income, the annual revisions to GDP released at the end of last month had clear effects on both income and spending. No longer is Q1 2015 so waywardly weak, but instead the aftermath of August 2015 is.
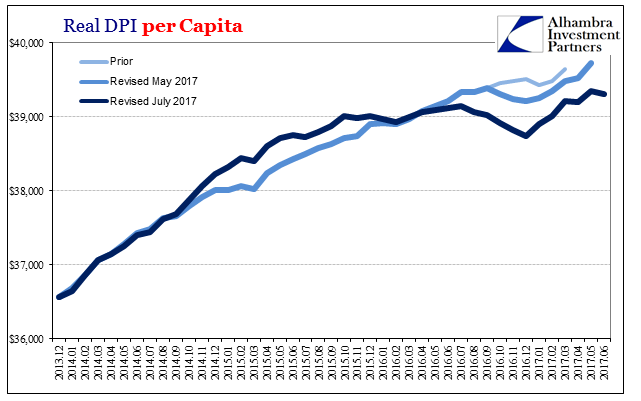
Since September 2015, Real DPI per Capita is now essentially unchanged, having been run lower in later 2016 as measured inflation rates (CPI) rebounded with oil prices. So while the upward revisions to primarily to the months of Q1 2015 give incomes a higher starting point, the US economy is clearly worse off in 2016 and to start 2017 (consistent with GDP revisions that show just how close the US came to full-blown recession in Q4 2015 and Q1 2016).
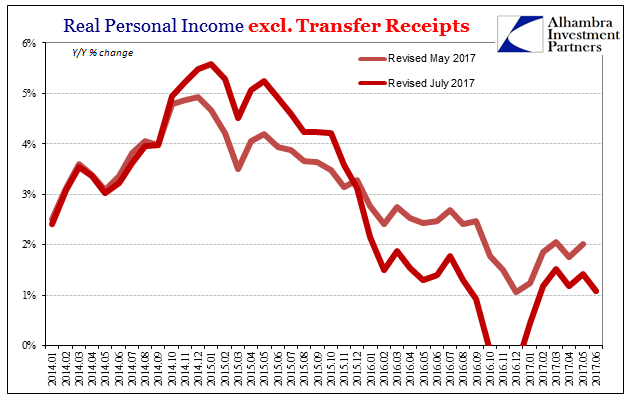
Such weakness transcends all forms of income data. The officially important series Real Personal Income less Transfer Receipts, one of the four non-labor metrics the NBER might use to declare a cyclical peak, has been similarly revised; up a bit in early 2015, then significantly worse off thereafter.
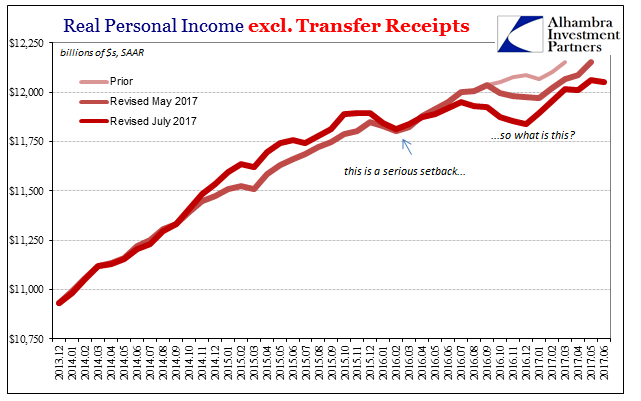
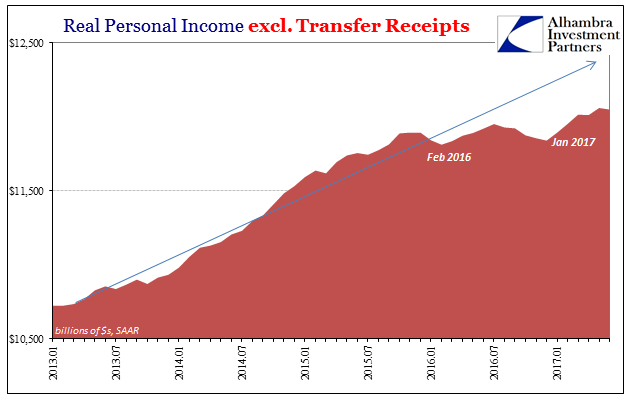
The updated figures now suggest that this measure of private incomes actually contracted for three consecutive months last year, which would be consistent with the aftermath of either a near- or mild recession. All that changed on the upside is the starting point (and altitude) from which the contractionary tendency began.
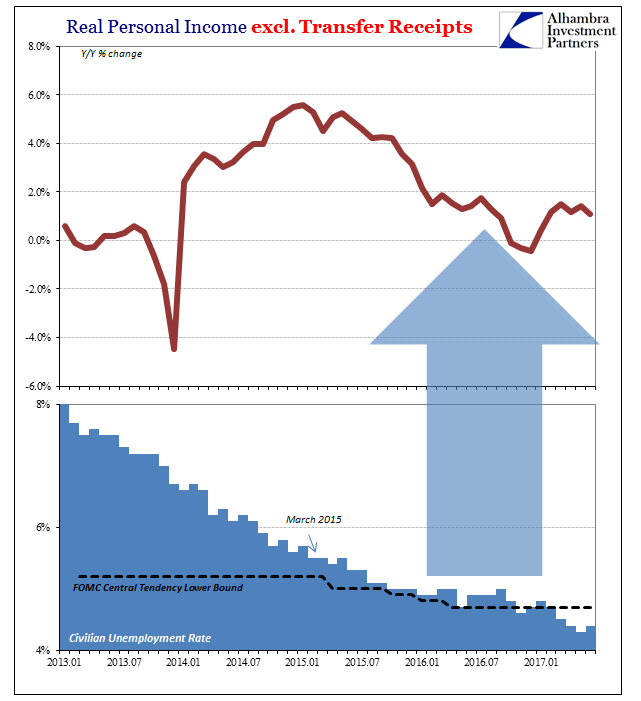
Obviously, that is not at all the same picture of the economy as given by the unemployment rate. An economy operating at “full employment” would not be in such a doubtful state. According the Federal Reserve’s latest models, the unemployment rate currently resides below their “central tendency”, meaning that in statistical terms there is a high probability the US economy is at full employment.
But it doesn’t act like it, as these income revisions show (assuming, of course, they aren’t going to be revised upward in the near future; it isn’t likely, however, as revisions throughout unrelated data are at least consistent with these new estimates in the sense of their downward nature and more so the timing of it). Instead, what is highly likely is that the unemployment rate is improperly skewed, leaving out the very important millions of prospective American workers who don’t fit the official definitions for its denominator.
PCE spending was revised slightly upward overall, but still since the middle of 2015 on a weaker trajectory. It suggests at first the remarkable resiliency of US consumers who continued to spend at even minimally growing levels despite all that took place during those “rising dollar” years.
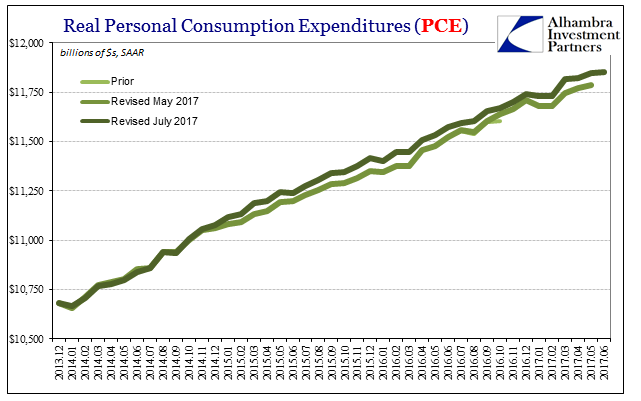
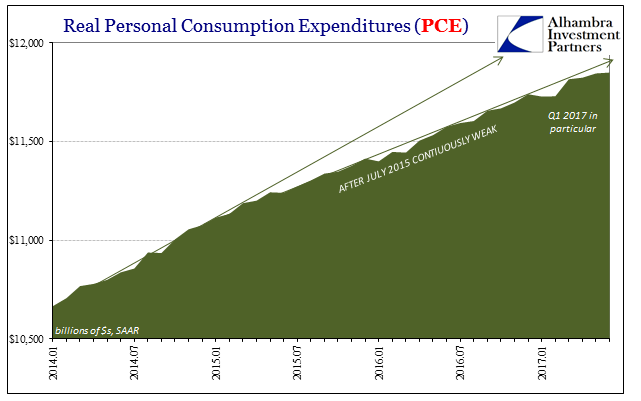
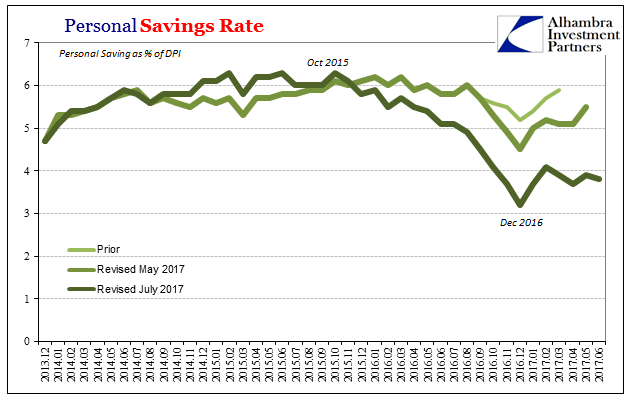
The net result between downwardly revised incomes and small upward revisions to spending is the savings rate that in 2016 and forward is completely different. Last August, the Personal Savings Rate was thought to have been almost 6% in July 2016. At the time I wrote:
The only economic data of note today was the notoriously unreliable personal income and spending figures. The data series contained within the suite are subject to not just major benchmark revisions but significant revisions within just the high frequency time frames. Perhaps the most pertinent example of this is the personal savings rate which has been revised all over the place such that there cannot be any confidence whatsoever in the statistic.
The current benchmarked estimates now say that the savings rate last July was instead 5.1%, and worse that it would fall all the way to just 3.2% last December.
That’s a considerable difference in appraisal. As I wrote at the outset here, given lackluster economic conditions it would propose as of now some reason for why there is no momentum in the middle of 2017 as there should be. The after-effects of the near-recession were large such that weakness especially in the labor market and incomes lingered long past what should have been recovery (there are several reasons for this, including of all things the distinct lack of inventory liquidation). In plain terms, consumers starting 2017 were drained, tapped out just to keep up weak spending.
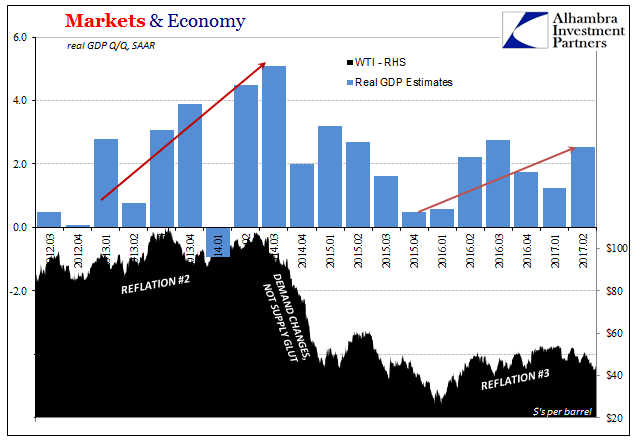
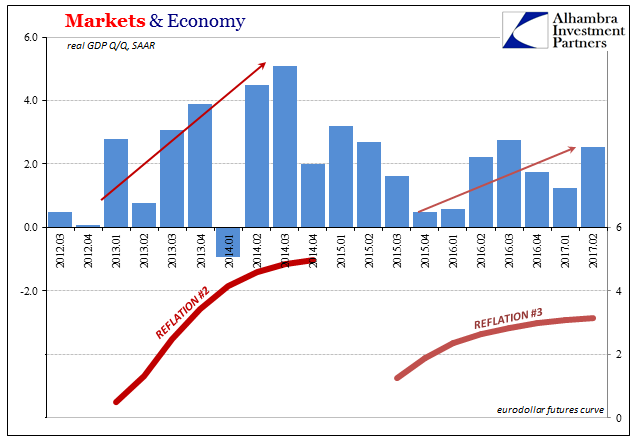
Overall, then, the economy was in a substantially worse position to start this year than previously thought (outside the bond market and eurodollar futures). As has been the case a lot over the last ten years, economists especially have been looking to statistics first often at the expense of market data that was telling them instead what they didn’t want to hear. These revisions, and others, show instead that it might be worth listening to markets and not relying so solidly on economic estimates that have proved at times like the “rising dollar” (or the 2012 slowdown) entirely too flimsy.
Stay In Touch