
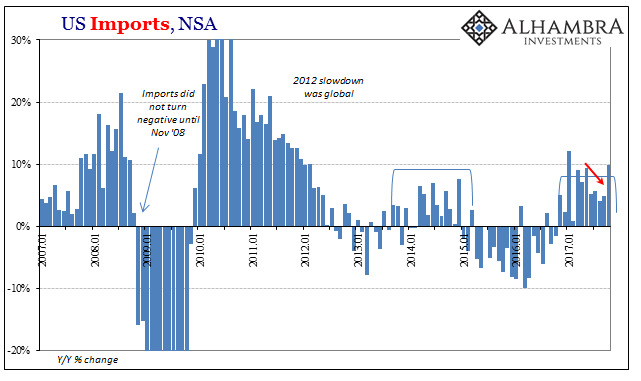
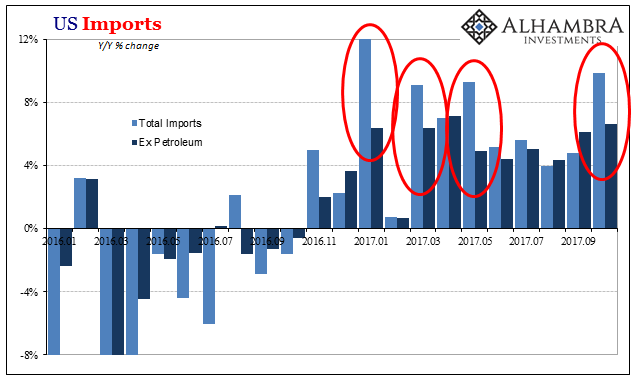
The Census Bureau reported earlier today that US imports of foreign goods jumped 9.9% year-over-year in October. That is the second largest increase since February 2012, just less than the 12% import growth recorded for January earlier this year. In both monthly cases, however, the almost normal rates of increase which would have at least suggested moving closer to a healthy economy (from the view of US demand) were instead boosted considerably by oil price effects.
Removing them, US imports excluding petroleum rose by just 6.7% year-over-year in October. That’s about the same level of expansion as the rest of this year, one that is so far slightly less than in 2014 and still nowhere near the economy of full employment.
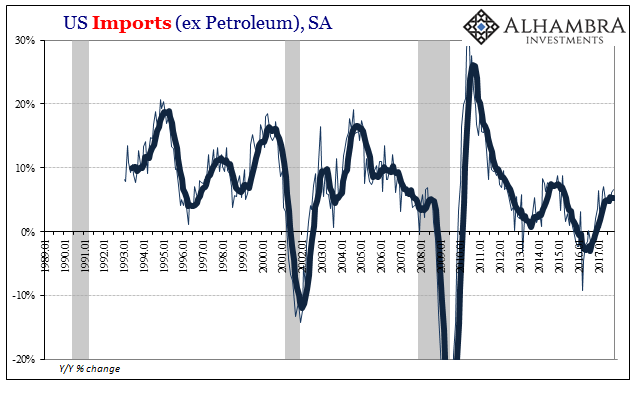
Past periods of overall US economic acceleration had produced much different levels of demand for foreign products aside from Middle Eastern crude. In 2004, for example, when that recovery, loosely speaking, finally kicked in US imports excluding oil were rising by more than 15%. With imports of crude climbing regularly by 30-50%, total US imports of goods from the rest of the world got to be nearly 20% at that time.
It was for our foreign trade partners their successful use of the eurodollar system to finance the building of their own productive capacities as well as the systems required (including financial) for such a high degree of trade mobility. Had that all been purchased by income growth via productive expansion in the US (a significant enough shift of high value payrolls for the low value jobs shipped overseas), the last ten years would very likely have been much different.
Instead, again, what was behind both sides was unchallenged monetary expansion. Absent that energizing, lubricating factor the world languishes everywhere; the rise of especially EM wealth during the last decade has proved so hollow, meaning it wasn’t really wealth at all.
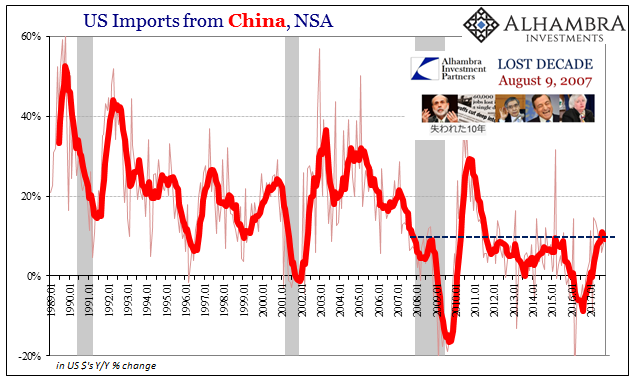
No one nation or system benefited more from it than China. In the middle 2000’s during the debt bubble housing mania, American imports from that country rose an astounding and steady 30% for several years. In January 2002, at the tail end of the dot-com recession, the Census Bureau estimates we brought in $8.4 billion of Chinese goods in that one month. In January 2007, the US imported $25.6 billion. Practically everything here had come to include a Made In China label.
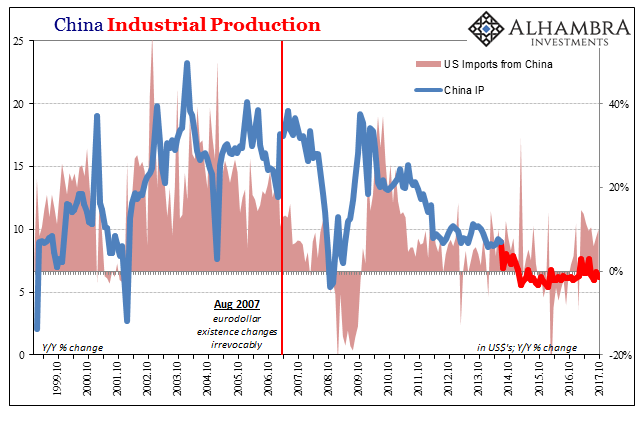
Total inbound goods trade with China rose 10.1% year-over-year in October 2017, a level of increase all-too-consistent with this most recent disappointing upturn. It’s nowhere near what the Chinese require to maintain their own internal economic, and social, order. The idea of “globally synchronized growth” that had become popular in 2017 remains quite true, just not in the manner that fad had imagined. It has left China to scramble toward a far more uncertain future than the one predicted just a few years ago.
The same goes for outbound US trade, as well. Exports rose by just 5.9% in October, as despite rhetoric of acceleration around the rest of the world it isn’t ever matched in the data. Exports (seasonally-adjusted) are just 2.2% more in the latest monthly estimate than they were in January 2017, suggesting that most of what little expansion occurred did so last year and then died off.
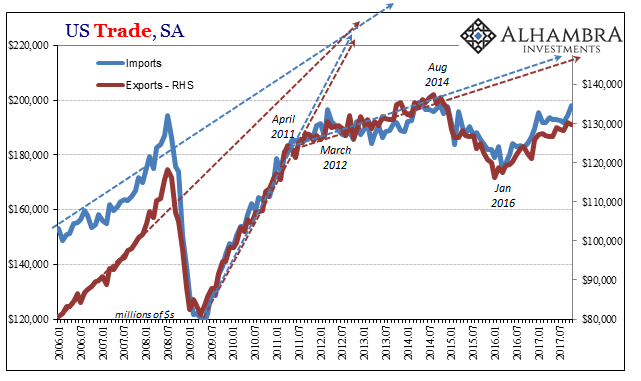
The adjusted series makes the trough of the 2015-16 downturn for US exports in January 2016. Closing in on two years later, exports are up just 11.8% from that low, and remain almost 6% below the peak set more than three years ago in August 2014.
These are not figures at all consistent with a 4.1% unemployment rate, and certainly nothing like what would be required just to start moving in the right direction. Based on cyclical considerations alone, given the lengthy if ultimately shallow contraction during the “rising dollar” period, US demand should be closer to, if not exceeding given other factors, 2004 rather than struggling to match the tepid upturn of 2014. It’s not, giving the flat yield curve even more emphasis, not that any was really needed.
Stay In Touch