
Is there a seasonal pattern to oil prices? It is beginning to look that way, though statistical purests would object to a sample size of two. Over the past couple of years, the switch between “reflation” and anti-“reflation” has taken on a little too much familiarity in terms of time and timing.
In the summer months between June and November 2016, oil was met with substantial volatility that interrupted its first rise off the absolute lows. That flipped to rising oil prices on much less volatility consistent with “reflation.” It lasted past the end of 2016 and into most of the first two months of 2017.
Then, starting February 24, back to volatility and the wrong trend again. The amount of time spent in that state was just about the same as the year before. Around October 2017, WTI broke to new multi-year highs and kept going all the way until January 26 – and the outbreak of those relatively minor global liquidations.
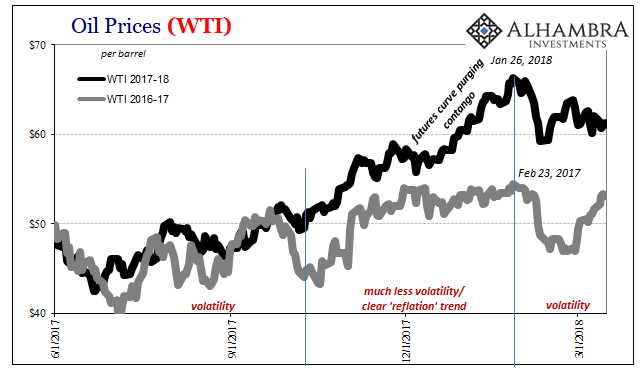
If we line them up at the respective peak of each one, it’s not a perfect relationship by any means but there is enough of a rough outline for possible seasonality (if we assume the difference in WTI “reflation” intensity at the end of 2017 was the purge of contango from the futures curve).
The timing is a bit off, but we might suspect the imprints of China’s Golden Weeks in all those inflections. Hoarding “dollars” between them (starting toward September) and placing those in the oil market? That’s perhaps a little too speculative at this juncture.
Whatever the case, oil prices as “reflation” (as inflation hysteria in some large part derived from WTI) have taken a break since that point in January, just as they did at the end of last February.
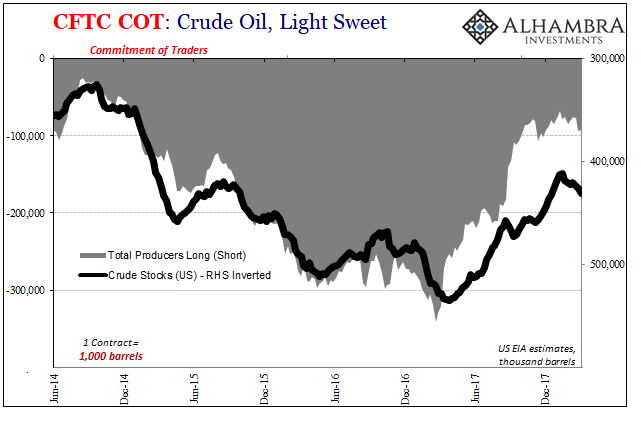
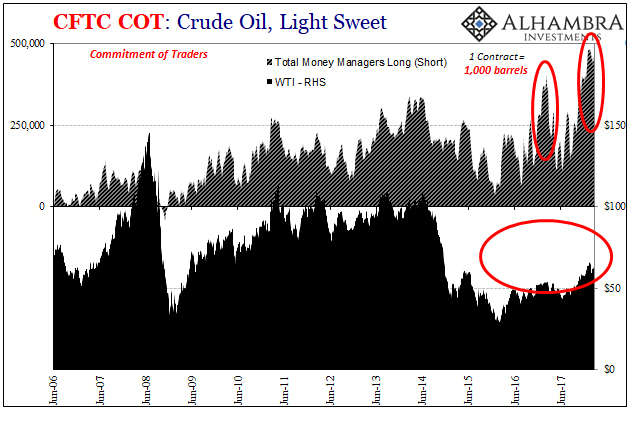
One of the most striking aspects of WTI’s most recent rise was the extreme positions on both sides of the futures market. Money managers, who had until 2017 pretty much determined the price of crude on their positioning alone, both last year and this year put on record long positions.
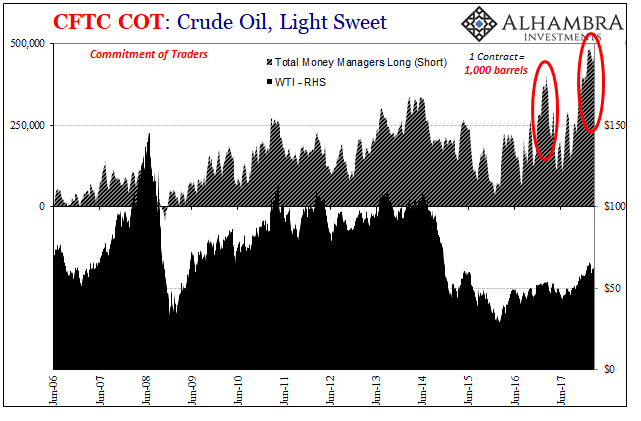
Oil prices somehow did not follow except as outlined in the seasonal pattern. The peaks circled above correspond to those in WTI in each year (2018 so far). On the flipside are the swap dealers who are to some degree actually short. They are also providing liquidity, which in futures markets means simply taking the other side of the money manager position.
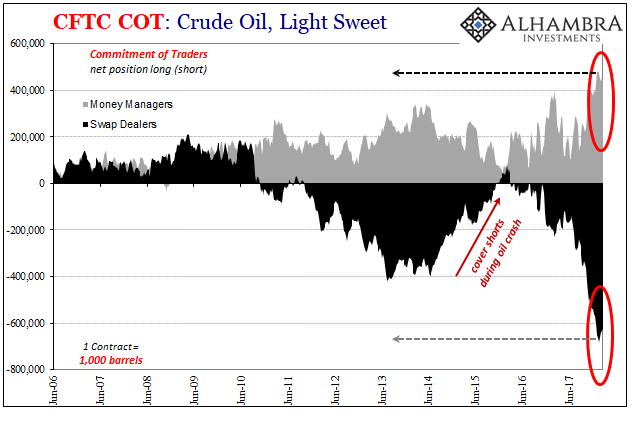
Despite almost two months since the multi-year high in WTI, neither side has budged. There was no mass short-covering which might have been triggered by oil’s big jump particularly December and January. Nor was there much paring back of the long side by money managers having seen oil liquidated along with everything else in the world – and then go no further.
It’s weird stuff that again proposes something else going on here, something different last year than prior years (though there was some detectable shift against money managers starting earlier in 2014, when the “rising dollar” first hit China).
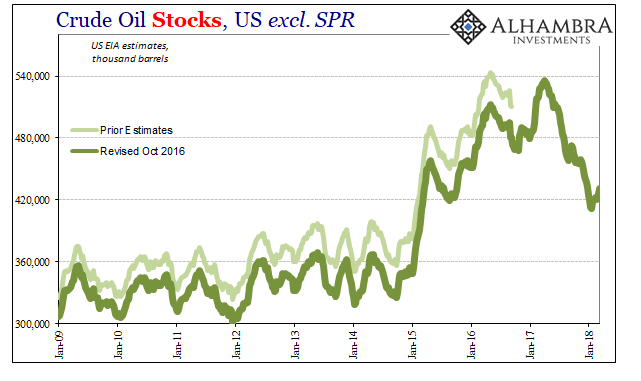
One more obvious change in recent weeks is the return of oil producers to hedge against inventory. Fundamentally, one of the primary drivers of positive oil positions was surely the drawdown of the so-called glut. Oil stocks throughout last year dwindled despite rising production, which many took as a positive economy signal (demand).
It does seem as if producers got a little ahead of themselves with “reflation” in WTI, especially as contango disappeared from the curve. That was to some degree understandable given the mainstream rhetoric. Institutional inertia in the energy space means what it does in a lot of other industries and markets; that Economists’ collective opinion about the future economic condition still matters, which then suggests that perhaps producers (as managers?) were influenced to some degree by the sentiment switch from reflation to inflation/boom hysteria.
The Fed certainly played its part in that difference. The FOMC was outwardly reluctant in its dots and rhetoric until last fall. Thus, it wasn’t too contrarian to doubt the sustainability of “reflation” and ultimately the ceiling for this upturn. Now, however, everything is less measured, which translates as making it harder to swim against the mainstream narrative (if I say things are getting better and they aren’t yet you can more easily ignore me; if I instead scream it, it’s not as easy to dismiss even though nothing might have changed but my pitch and intensity).
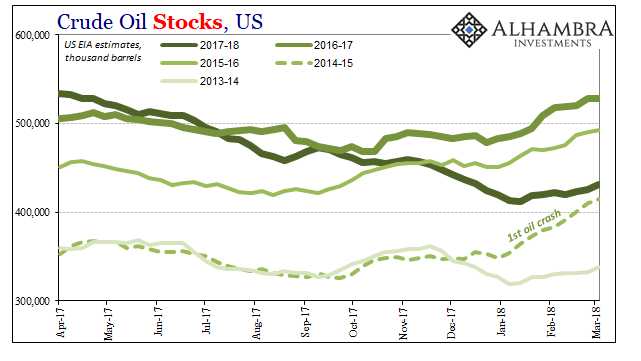
A less hysterical view of oil fundamentals, in my view, indicates that despite clear progress (economic upturn) oil stocks are still way too far out of balance. They are not rising as fast as they did during the seasonal accumulations at the beginning of each of the three previous years (2015, 2016, 2017), but that’s not the appropriate standard for analysis. Inventory is still far more than to start 2014.
It might suggest less upturn than imagined, therefore a lower probability of an actual boom, meaning that rebalancing the oil market might be further out into the future, therefore increasing the risks of something (like “dollar”) interrupting the trend before it reaches that critical point.
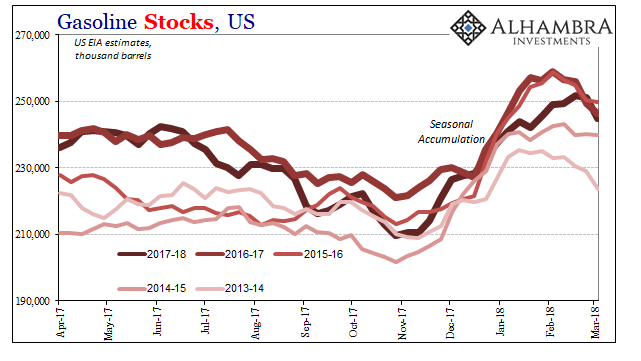
The sharp rise in gasoline stocks reinforces the notion that economic rebalancing across the whole sector isn’t proceeding quite as fast as hoped. There was a lot more of it during this latest seasonal accumulation period, meaning some of the inventory drawdown out of crude was merely shifted to gasoline.
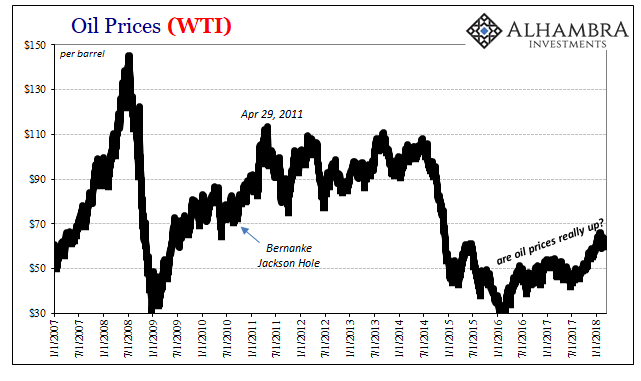
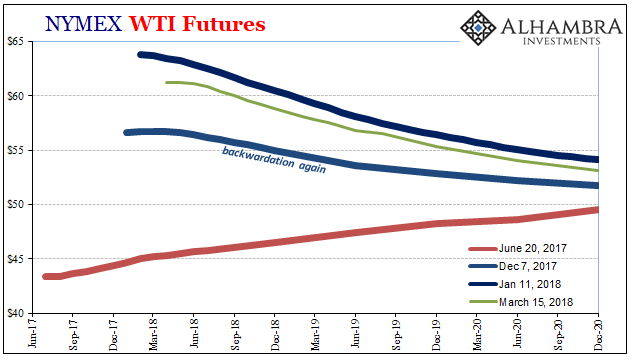
None of this was exactly a surprise given where and how the futures curve moved back into backwardation from contango in the last half of last year. The curve at the farther maturities anchors around $50 to $55 rather than $85 to $95 as it had in the summer of 2014. That difference contains a whole lot of uncertainty about “reflation” and the oil fundamentals proposed by it. It’s not the curve that would immediately propose money managers going big record long (but it might suggest why swap dealers are to whatever extent outside of liquidity providing activities so short against them).
There’s something missing here and it bears some resemblance to a repeating, perhaps seasonal pattern.
Stay In Touch