
The Federal Reserve published its latest update for Z1, the Financial Accounts of the United States (formerly Flow of Funds). That means we can update our valuation metrics for a good piece of the US stock market.
Tobin’s Q starts with the premise that the value of any company is in many ways dictated by its accounting net worth. We don’t have any other comprehensive sources for the aggregate net worth of nonfinancial corporate businesses, so Z1 statistics are as close as we can get. But the way in which net worth is calculated raises some issues.
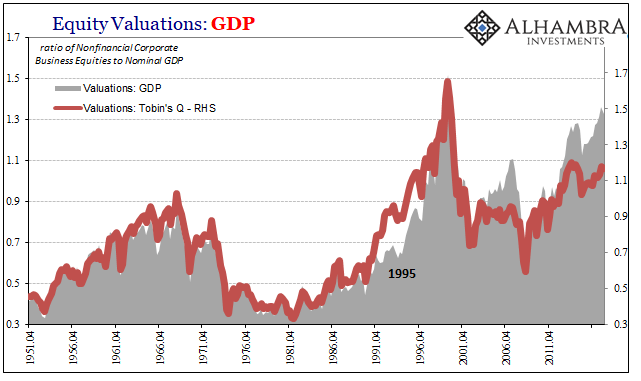
To start with, equity valuations remains high. They have, by virtue of Tobin’s Q, very nearly retraced the “rising dollar” rough patch that produced in terms of corporate results a profit recession. The lack of liquidity combined with gross uncertainty particularly across the whole global economy produced several liquidations which for a time pushed down stock prices.
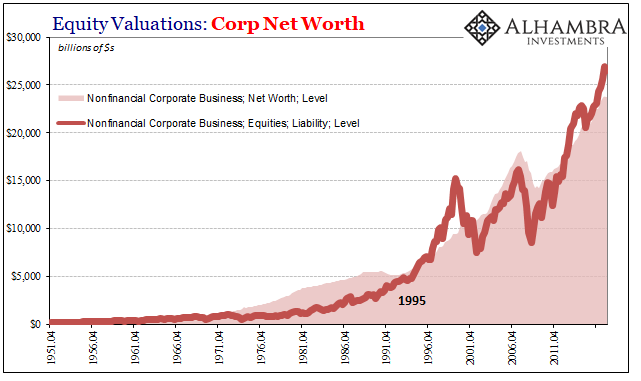
Following all that, in 2016, stock prices came roaring back. According to the Z1 estimates, so did corporate net worth. In fact, corporate net worth barely noticed that downturn.
This is a peculiar development for several reasons starting with profits (and cash flow). Profits, according to other sources, have largely stagnated since the middle of 2014. They came back from the lows in the middle but going no farther (to this point).
For net worth to rise so precipitously at nearly the same rate as share prices hints at something else.
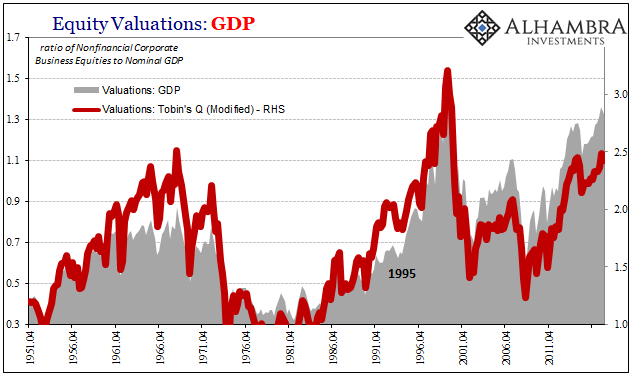
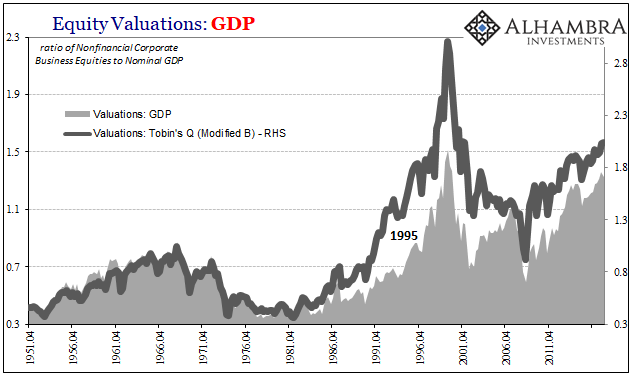
I usually provide in these valuation updates an alternative view of Tobin’s Q (above, notated as “modified”). A big part of corporate net worth comes about because of the quite natural real estate holdings reported by these entities. In the regular course of economic business, nonfinancial firms are going to obtain and develop property. But these holdings are reported at market values, meaning that overall net worth (assets minus liabilities) is susceptible to non-economic deviations in the price, too (bubbles).
Given that the whole point of going through some of these valuation differences is to isolate possible bubble irregularities, a bubble in corporate property values would then be used to justify in a way a corporate equity bubble (by artificially raising net worth due to a bubble in one part which then seems to make the stock bubble appear less of an imbalance).
One of the things you can’t help but notice on the charts above with either version of the Q ratio is that corporate equity valuations appear much more stretched compared to nominal GDP than net worth. This is a relatively recent change, going back to the 1990’s, and it is exactly the possibility our modified Q was meant to isolate.
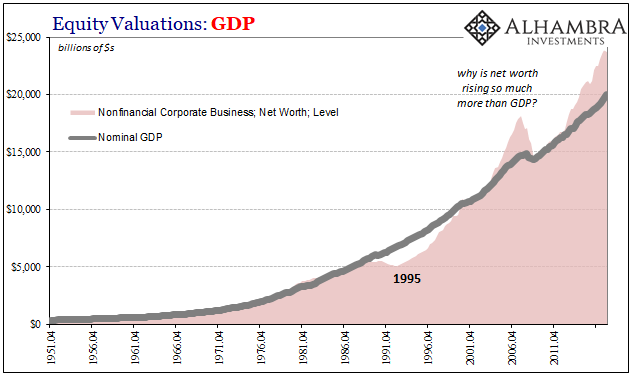
The relationship between corporate net worth and nominal GDP has clearly changed. Once a pretty constant nearly one-to-one relationship, companies’ collective net worth is now higher compared to this measure of economic output. There could be several reasons for this, including a smaller contribution from the non-corporate sector, but closer inspection of the components of net worth points us in another direction.
It may be that I have been subtracting the wrong line for a more accurate Modified Q.
As always with these kinds of figures and data series, we have to make due with often substantial amounts of whatever part classified as “miscellaneous.” It’s just the way these things always work out, a reminder of the difficulty in gathering information as accurately as possible for such a complex and (incomprehensibly) large system.
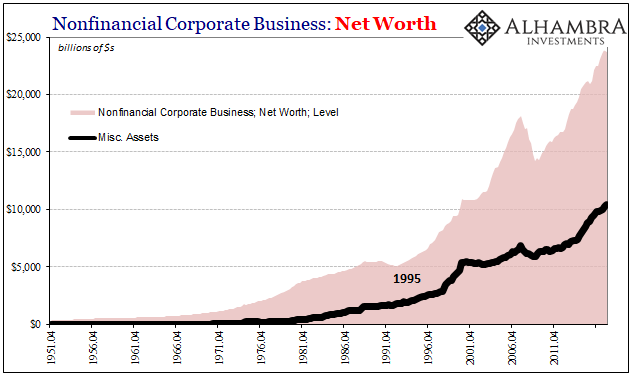
As you would expect, nonfinancial corporate assets include a miscellaneous line, too. What you might not expect, however, is just how much that line has expanded since the early eighties, and really since the late nineties.
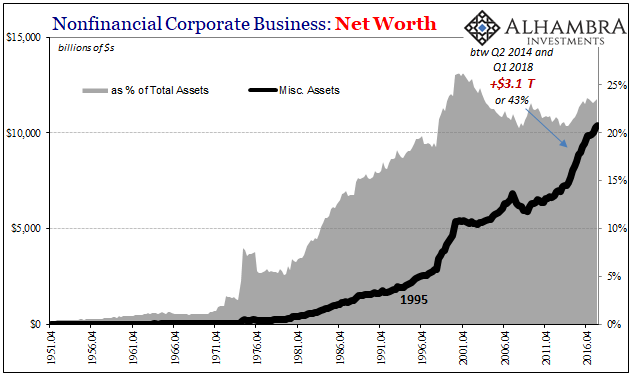
In fact, in recent terms more than half of the rise in corporate net worth since the middle of 2014 is due to this one unidentified piece. As astounding $3.1 trillion has been added in some way that can’t be specified. The only other time miscellaneous assets rose so far so fast was the last two years of the dot-com bubble.
Viewing net worth in this way, we can see the reason why the relationship between nonfinancial corporate net worth and nominal GDP has broken down as it has. We can’t say for certain exactly what this all is, but there is the suggestion that like the possibility with real estate assets net worth since the middle nineties is being defined perhaps by other types of activities not related to direct economic purposes (financial, therefore price sensitive).
When we subtract miscellaneous assets (as an aside, there isn’t a corresponding rise in miscellaneous liabilities) from net worth, we find that in fact that portion of the figure is largely responsible for these differences in valuations.
In other words, whatever this is under “other” it is creating more corporate net worth which then according to the Q ratio perhaps understates the degree of over-valuation (it’s a tricky series of logical leaps). To put it more broadly, there may not be as much economic-related net worth as the published figures identify because of what’s not being identified and therefore may have been derived by something other than economic value.
A lower economic net worth means stocks are priced at a greater premium than we might otherwise think, which is what you see above with what I’ve now created and identified as Modified B.
What this alternative view shows, and what I think is most important, is just how much things have changed since even the early 1990’s. The timing therefore casts suspicion upon bubble types of assets and holdings because it was around that same time when the eurodollar system really came to full bloom.
Whatever it is, depending upon how actual businesses view this thing in the real world (it may be nothing more than a number in a government report that businesses don’t really consider), it may suggest one reason for so many economic difficulties particularly on the so-called supply side of the economy.
If corporate businesses are actually treating this as a real asset as a result of a real process, deriving a substantial portion of net worth from possibly non-economic activities (I can’t discount corporate repurchases as being included on this line, but I don’t know enough of the accounting and I can’t find my old Flow of Funds handbooks at the moment to clarify whether they would end up here or as an offset on the liability side) might help explain why business investment in real economic terms has been so underwhelming in the 21st century. It has added up to the point that productivity growth since the Great “Recession” has been practically nothing.
If you can grow your net worth via something that has little or nothing to do with the economy, the economy then doesn’t grow as much which only suggests doing more of the non-economic thing.
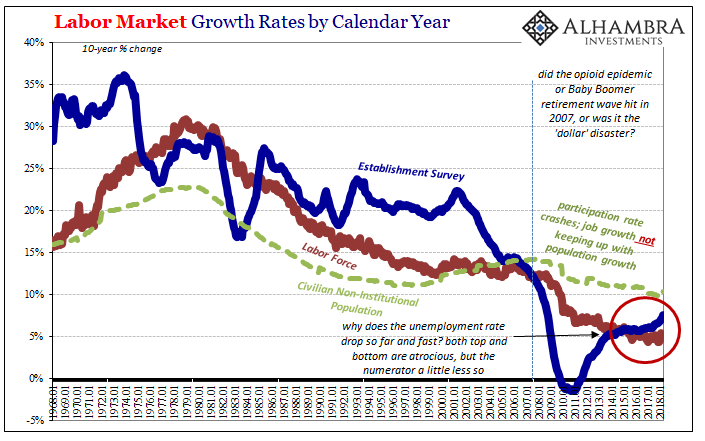
It still doesn’t change the fact that equities are substantially overvalued by any historical comparison. It does, however, raise significant questions about why that might be, particularly as it relates to the economy that can’t seem to ever live up to share prices (at least since the middle nineties). Corporate net worth could be mysteriously financialized, which in real practice is possibly as bad as it sounds (see: labor market since 2000).
Unfortunately, more suspicion and questions than answers.
Stay In Touch