
Before August 2007, US$ money markets operated efficiently and predictably. They behaved according to a rigid hierarchy, which is a good thing no matter how it may sound. This inflexibility in the context of funding markets was exactly what we would want.
Arbitrage opportunity was responsible for enforcing the rules. One simple example was the difference between repo and federal funds. If the latter was transacting at X, we could be reasonably sure that the GC repo rate was some small spread below X. It made intuitive sense given how federal funds is overnight unsecured while repo is overnight secured. You pay less interest for posting collateral; your counterparty accepts less interest for the collateral posted.
If either rate started to stray, there were large money dealing firms who could take advantage. If federal funds were to fall below the repo rate for whatever reason, a bank or non-bank participant could borrow in federal funds and simultaneously lend in repo. The result would be the two rates moving back to where they belong. This is one example of covered interest parity (CIP), or the internal behavior of money dealing that used to create, again, efficient and predictable money markets.
Absent CIP, money dealers not only wouldn’t know when to act, they wouldn’t really know how. If there is no hierarchy, where “should” the repo rate trade? If you don’t know the answer to that question, you can’t really classify anything related to it as arbitrage. It’s all just a muddle.
That hierarchy had proposed a seamless, single money market operation spread all over Earth. In actual fact, however, US$ markets were never so monolithic; anyone might have thought they were simple because covered interest parity in practice closely matched it in theory. To accomplish this “magic trick” merely required money dealing banks to employ sufficient balance sheet capacity over every timescale.
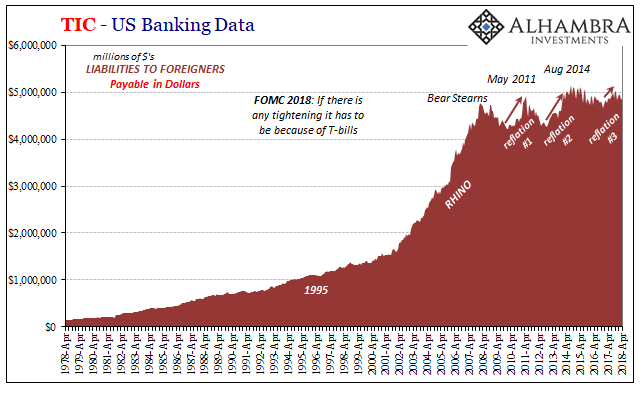
Nowadays, not so much. Over the past few months, the repo rate is well above EFF and even more than IOER. Why? The FOMC and the conventional “wisdom” hands us T-bills as the answer.
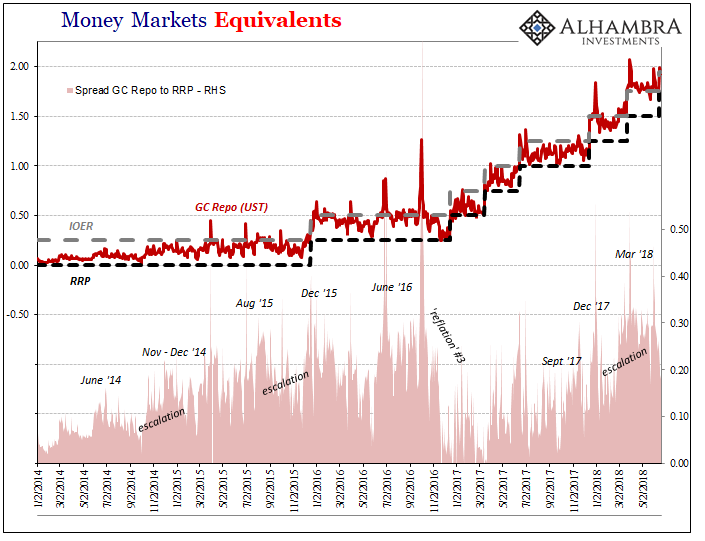
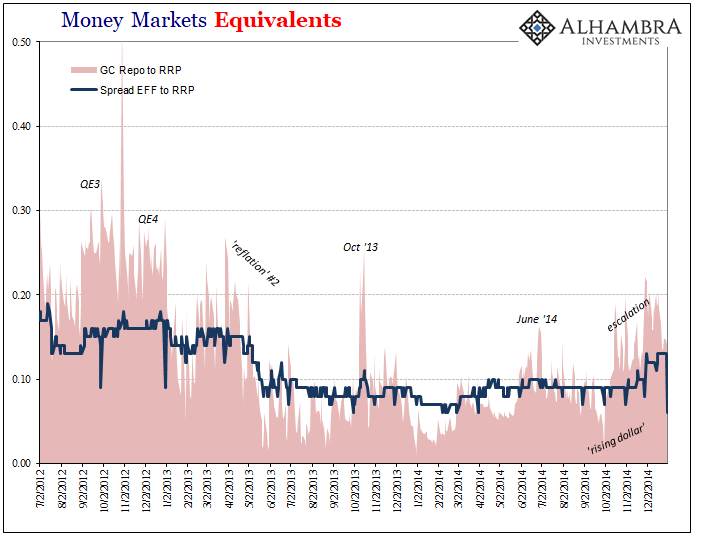
The problem with that theory is immediately recognizable on any chart that examines a period longer than just this year. The relationship between GC repo (UST collateral) and the RRP (for the sake of consistency, as you’ll see below, I’m using the spread of GC over RRP) outlines prior trends that have had nothing to do with T-bills or QT.
What is clear above is that the GC repo rate tends to rise even above the federal funds target range whenever things start to go wrong. In 2014-16, that was the “rising dollar” which perplexed mainstream commentary into admitting some “overseas turmoil.” As usual, the problem wasn’t overseas so much as offshore (eurodollar).
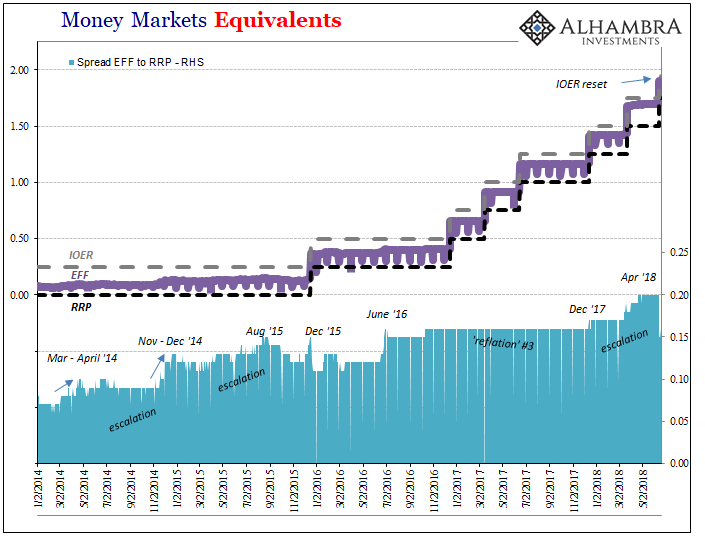
It’s basically the same exact pattern I’ve shown before, using effective federal funds (EFF) in relation to the RRP. What we find when we put those two charts together (below) is unsurprising; both EFF and GC repo tend to rise relative to the monetary policy target range whenever things offshore display “tightness” for whatever reasons you may choose to assign.
What we can’t help but notice, however, is that things really pick up when the repo rate strays further than the effective federal funds rate does; such as over the past few months since March 2018.
As noted above, the repo rate isn’t “supposed” to move above let alone stay above unsecured rates for any length of time. We can only infer continued serious fragmentation among money markets, a negative factor that displays all the opposite tendencies from the beneficial hierarchical relationship that once existed dependably in the eurodollar buildup phase (up to August 2007).
Still, even though it isn’t the “right” relationship between GC and EFF, there is one anyway. In other words, whatever it is that may be going wrong at any one time shows up in both repo and federal funds but not equally.
To buy the theory that T-bills are responsible requires you to ignore everything that happened before. And the repeating pattern we see here is not just a recent phenomenon dating back to 2014. It, in fact, corresponds with the prior renewed “dollar” problems and their eventually dissolution at each point throughout the last decade.
In addition to the “rising dollar”, we find the same up to and after 2011:
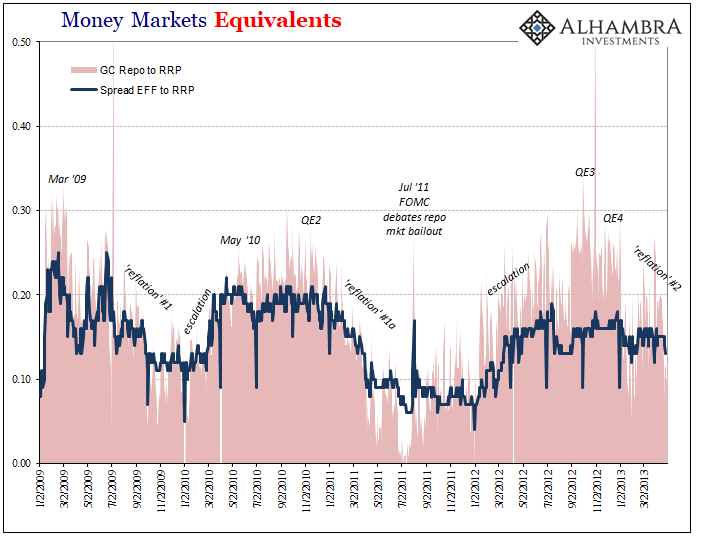
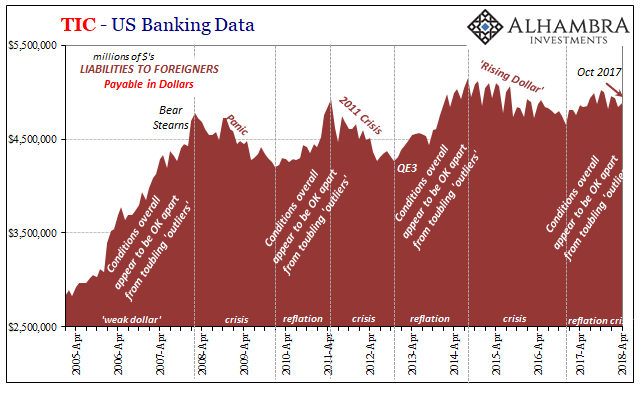
It also follows in 2013 as reflation in between the 2011 crisis and 2014’s introduction to the “rising dollar.”
Let’s stop here to review in order to make some broad generalizations. The repo rate tends to behave both with respect to the monetary policy target band (as defined by RRP at the bottom, I won’t call it a floor, and IOER at the top, I surely won’t call that a ceiling) as well as EFF when things generally seem to be good. When reflation in sentiment as well as these small upturns in economy are present, there is clear correlation to US$ money markets if not obeying CIP as they used to then at least pretending for significant lengths of time.
The opposite case also holds true, meaning that when things tend to be going wrong we can be reasonably assured repo is in the wrong place with respect to the target band as well as EFF. CIP has broken down (or further broken down) suggesting, very strongly, a distinct lack of balance sheet capacity in absolute terms as well as in relative comparison to those reflation periods.
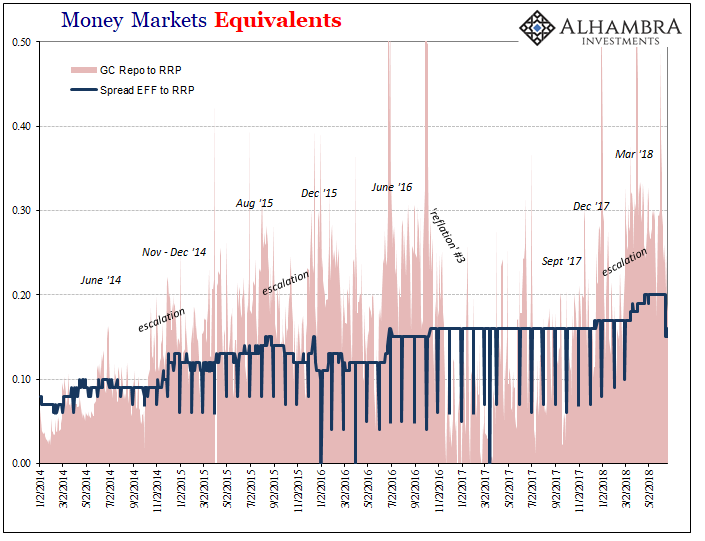
All that’s left is to validate this gyrating limited CIP, and therefore balance sheet capacity, to some external data. What you see below is the chart above married with the first one in the series showing repo’s place relative to the target band (RRP). You will likely not be surprised to find just how closely they match.
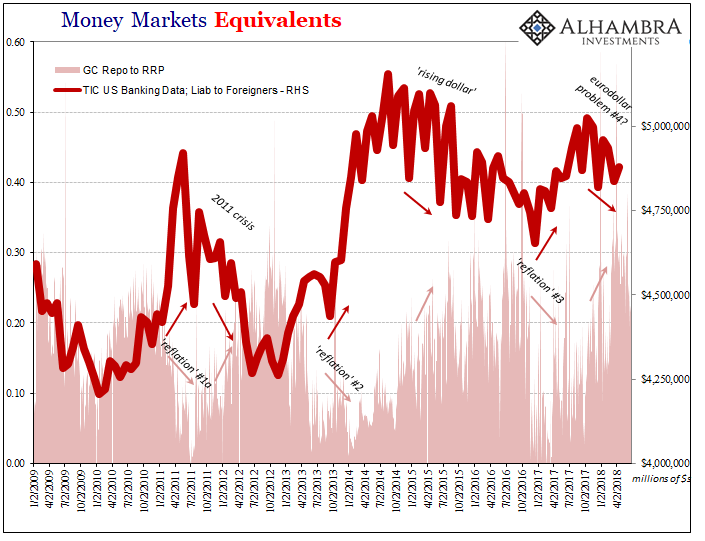
The inverse relationship is very well defined throughout, with the exception of early 2010 when TIC shows rising US$ liabilities (US banks borrowing US$’s from offshore entities) despite indicated “tightness” in a relatively rising GC repo rate (this was the “flash crash” and then the ECB’s first big entry in PIIGS). Apart from that, since 2010 I’m not sure how much clearer any complicated (and hidden) relationship could ever get.
Thus, we are back to the initial theory, CIP not T-bills. If you think recent troubles are due to the latter, then how do you explain its consistency with ten years of totally unrelated behavior (with respect to bill issuance)? In my view, it’s not more likely rising money rates have nothing to do with T-bills, it really can’t have been (and still be) anything else other than a continuing of the same unfortunate oscillating eurodollar breakdown.
Eurodollar banks have displayed almost textbook schizophrenia; a Dr. Jekyll and Mr. Hyde interchange. When they are more optimistic, usually whenever some major central bank somewhere is doing something, they tend to expand and more freely expend balance sheet capacity. Repo falls back more in line of CIP.
When that something is later proved to be ineffective, and projections as to its efficacy are shown to have been way too overoptimistic, they respond by pulling back balance sheet capacity. CIP breaks down all over.
It doesn’t come all at once, rather it is an often lengthy and involved process of re-evaluation where the level of uncertainty (the difference between expectations and current perceptions as to their potential validity) dictates the balance.
The real issue in my mind is why banks don’t seem able to learn despite the repetition. I think that gets back to a deeper truth related to the breakdown of CIP, the fragmentation of money markets, and the important behavior within them that if nothing else can be an invaluable tool for discerning the baseline trend.
We are not programmed to easily accept a permanent break. Even after ten years, it’s easy to still believe that it all goes back to normal tomorrow. It may even become something of a blind-spot, where the more time passes the more certain you become tomorrow just has to be the day normalcy happens for reasons you don’t need to detail.
A paradigm shift especially in something as monumental as the global monetary system and economy is nearly incomprehensible, beyond everyday reasonable grasp. Therefore, despite past experience, even recent experience, “we” very easily expect that what comes next after each nasty event must be mean reversion.
But what the consistency of these money market behaviors tells us instead is that the mean or baseline isn’t the same at all as what it used to be. If that is broken, there can be no reversion, at least not without some massive undertaking that actually addresses the paradigm shift in a meaningful way. Balance sheet capacity, not bank reserves.
If you believe in bank reserves, however, sure, what else is there besides T-bills?
Effective federal funds was steady Friday at 1.92%, still -3 bps to IOER.
Stay In Touch