On December 5, 2014, the Bureau of Labor Statistics (BLS) reported that in the month of November 2014 nonfarm private payrolls had surged by +321k. Typically bureaucratic, the introduction to the report was unusually blunt. “Job gains were widespread.” The text didn’t come right out and say it so the media did it all for them.
TD Ameritrade’s Chief Strategist JJ Kinahan was pumped, declaring the November numbers, “outside any estimate I had seen even on the high side. Overall this is a home run in terms of jobs created.” There could be no doubt that this was the best jobs market in decades. As such, my absolute favorite quote from that entire period was uttered by PNC Economist Stuart Hoffman.
If you don’t like this one [Nov 2014] nothing is going to make you happy.
The good news wouldn’t end at the November headline. Average weekly earnings were up sharply, too. Rising 4.2%, it was the best paying month for production and non-supervisory employees in more than four years.
Two months later, in early February 2015, the BLS would revise its November 2014 numbers. Payrolls hadn’t gained +321k as originally thought, the government agency would say it was so much better than that. It was an incredible blowout month, +423k, followed by +329k in January, and then the initial estimate for February, +257k. By that time, +257k in February was disappointing.
If you don’t like these nothing is going to make you happy.
I am nothing if not Mr. Nothing. Apologies to all Economists, but you can, in fact, look at a payroll report such as the one for November 2014 and realize it won’t make anyone happy besides Economists, central bankers, and the media. Economic joy just isn’t going to be found in these BLS figures.
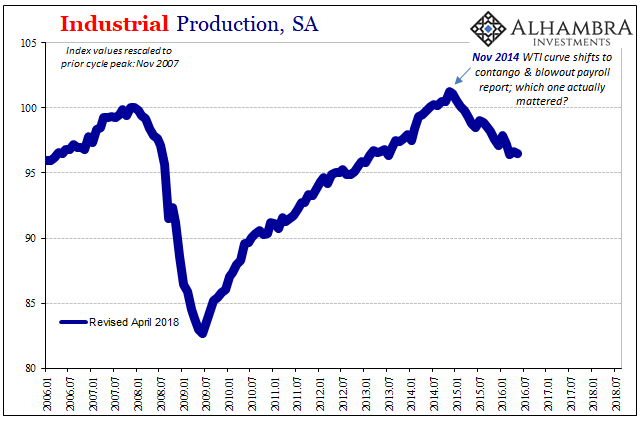
At best, the employment numbers since 2014 have been irrelevant; at worst, they can be, like the unemployment rate, highly misleading. They certainly were in 2014 and 2015 heading into what was near-recession downturn. Ironically, despite all the recent hoopla and hysteria, the labor market hasn’t been the same since.
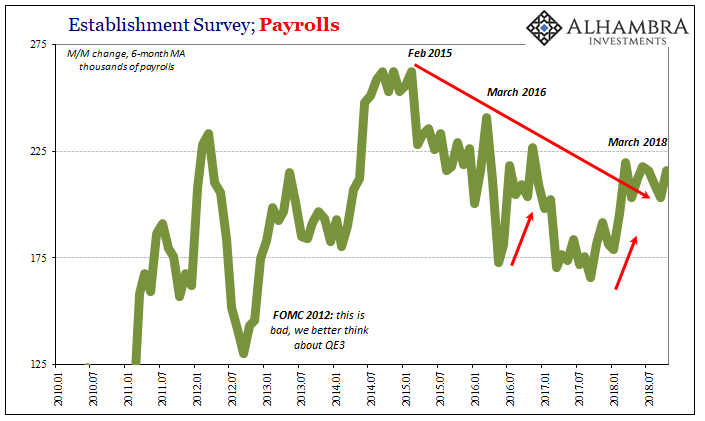
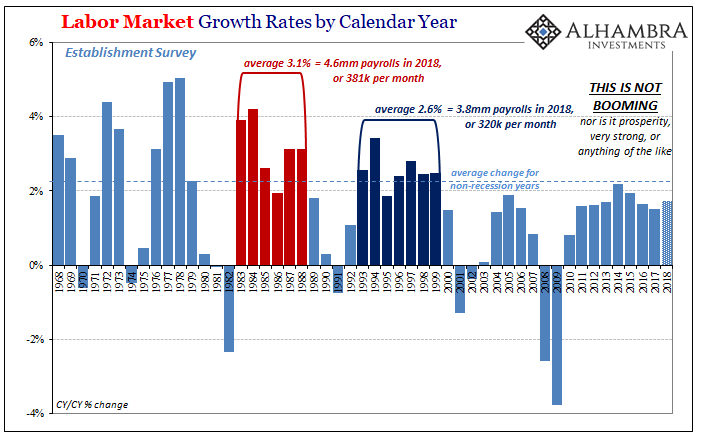
We were due for a perfect payroll report. The last one by my unofficial count was for the month of February this year, an unusually long stretch without this sort of excellence. The latest data for October 2018, released today, certainly qualifies. The headlines were good (+250k), by recent standard, upward revisions to prior months, a significant jump in the labor force, the Household Survey surged, and then the 3.1% hourly wage gain.
The best wage growth in ten years, if you don’t like this one nothing is going to make you happy.
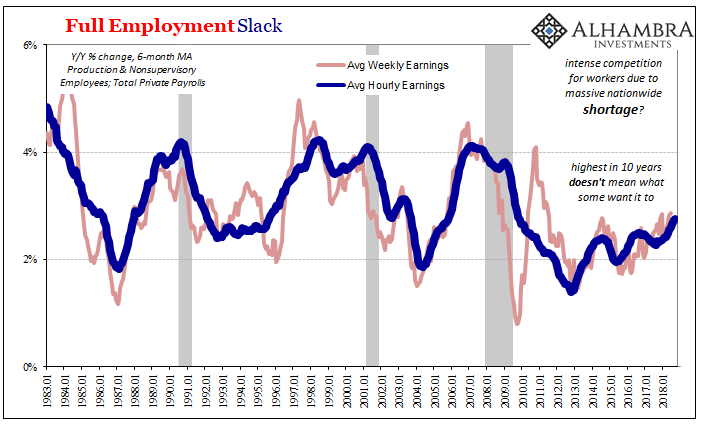
Make it the best in twenty or thirty years, then you’ve got something Mr. Economist.
Paul Krugman, of all people, described this predicament pretty well when referring to Japan in the late nineties. Their S-curve was too shallow (E on Krugman’s chart below). There are good times and bad times on the lower curve, just as there are on E’. But on E’ the highs are high enough that the lows don’t lead to perpetually bad all around.
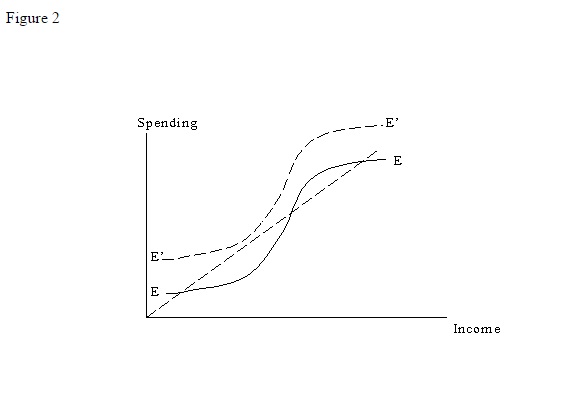
Everyone can be happy on E’ because it is there where the economy can finally escape from its rut.
The labor reports, all of them, all of those perfect months over the years, they continue to follow along E rather than E’. It really is that simple. The economy is in a reduced state and has been this way for more than since the Great “Recession.”
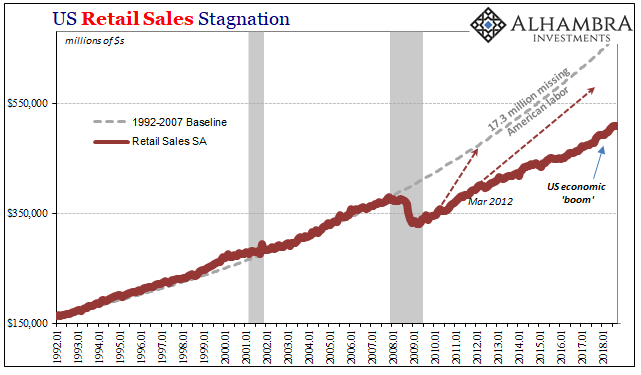
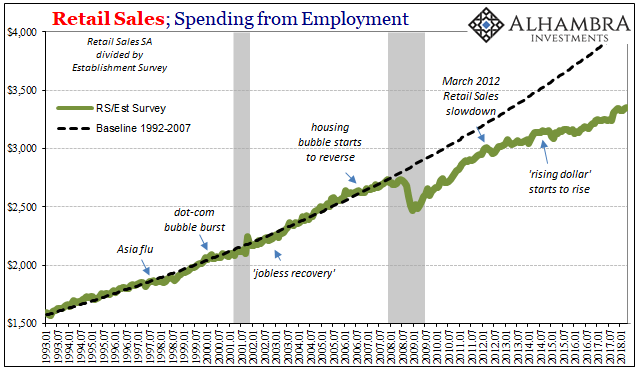
This is why the payroll reports are, in real economy terms, irrelevant. Whether they are exemplary or disappointing, they are all in the same class (E, not E’). The chart immediately above displays exactly this S-curve dynamic. US workers are not spending (retail sales) the same proportion as they did per payroll prior to 2008; and it’s only gotten worse (further behind trend) since 2012.
The trick, as Krugman was trying to get at, was in breaking out of that class and back into an actual growth paradigm.
Now you could argue that the experience of the Depression and after provides just such evidence. Many economists thought that with the end of World War II spending the United States would revert to Depression-type conditions; a whole school of thought, the “secular stagnation” hypothesis, was built around that idea. In fact, once jolted out of depression, the U.S. did not fall back.
I don’t think Krugman was or is right about what kept the global economy from falling back in the later forties, but that’s immaterial to this discussion. The point is that back then the world needed a jolt, whether it was world war or stable, predicable global money. It got it and never looked back; Alvin Hansen and all those following his secular stagnation paradigm looked silly for really believing the economy of the late thirties was the best that could be done.
War, in fact, was the inevitable result of surrendering to the unacceptable; being happy about the lackluster as the absolute best of things.
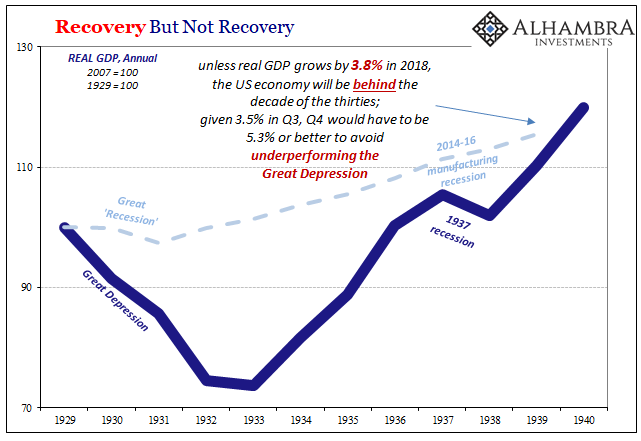
The first step in the other direction would be incredibly simple – recognizing which S-curve we belong to. That isn’t being done and it’s eleven years already. Economists, to be frank, are the reason why. They are overjoyed with upswings on E, indelicately giddy in talking them up into monstrous gains that are really minimal, when they should be frustrated and explosive. Regular folks, they exhibit just those qualities.
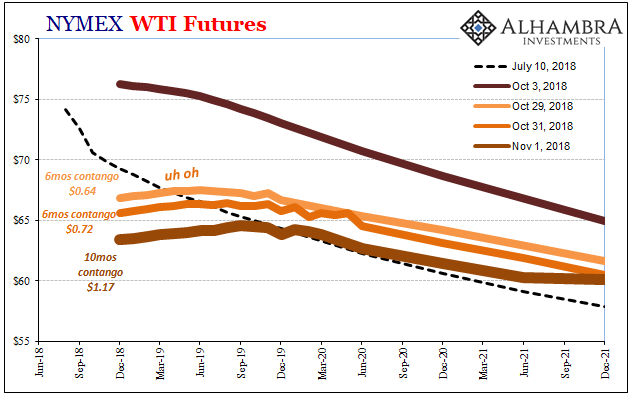
If the employment estimates were consistently good on historical terms, the WTI curve wouldn’t be flipping back to contango again during a month when the BLS numbers are read so incorrectly. October 2018’s was a perfect payroll, but only on E. If the economy was really booming and had actually made it up to E’ over the last four years, we would all be worried about what was seriously wrong last month that only +250k payrolls were added.
This is where WTI, eurodollar futures, and the yield curve (among many others) already are. These financial curves know the difference in economic curves.

Stay In Touch