
It was a forgettable moment. The Federal Reserve’s Chairman at the time, Janet Yellen, was asked about a key economic statistic and she just couldn’t come up with it. In September 2016, Yellen was on Capitol Hill to testify as she usually did about how things were surely getting better. Rep. Frank Guinta wanted to know what that might mean in terms of the labor force participation rate. He wanted to know what it was in the preceding month, but Yellen had to shuffle hastily through a number of papers in order to find it.
It’s easy to draw a blank when answering questions outside prepared remarks. The incident itself tells us nothing about Yellen, except that she was and is like every other public figure. Still, to have spaced on that particular number almost invites reading too much into it. Something about Freud.
The labor force participation rate is one of the key puzzles, or conundrums if you like, of the last decade plus. For Federal Reserve officials, beginning under Yellen and now continuing under her successor Jay Powell, it has been one of the few happy endings. That’s not to say it indicates full recovery, only that perhaps the bleeding after 2008 finally stopped.
Officials are placing some significant degree of emphasis on its lack of further deterioration. Janet Yellen would turn to the participation rate, in prepared remarks, of course, at her final press conference in December of last year:
Given the underlying downward trend in participation stemming largely from the aging of the U.S. population, a relatively steady participation rate is a further sign of improved conditions in the labor market. We expect that the job market will remain strong in the years ahead.
In every business cycle trough, or recession, workers exit the labor market discouraged that companies are more likely to layoff employees than hire new ones. Everyone knows the economic score. When recovery happens, the process reverses because similarly both workers and prospective workers understand what businesses are doing.
One of the big mysteries, sort of, was how the labor force continued to shrink year after year. As Yellen said in December 2017, Economists have come up with certain theories to try and explain this dissonance, Baby Boomer retirement among them (drugs and a nebulous skills mismatch the others).
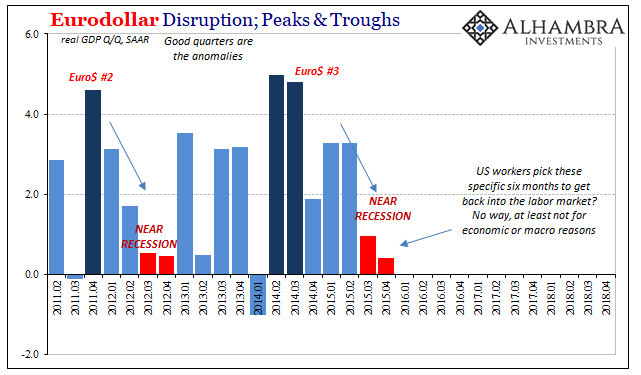
What isn’t really up for debate is the beginning of the cycle. The LF participation rate had come down from its peak in 2000, but it didn’t really begin to recoil until September 2008. This part needs no explanation, as I’m sure it is perfectly uncontroversial as to why American labor would become so discouraged starting with the sight of Lehman, AIG, and TARP.
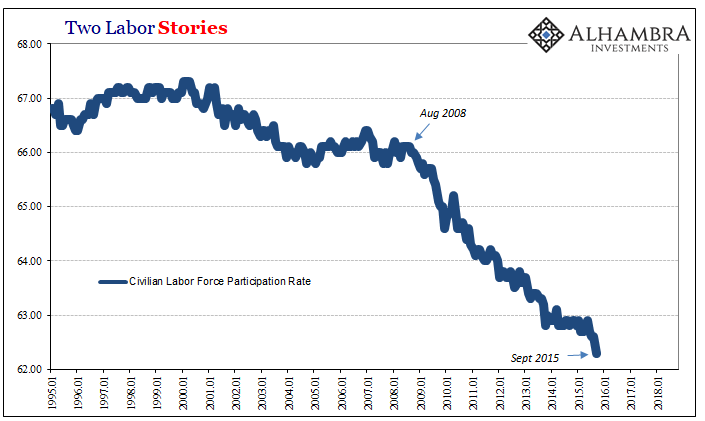
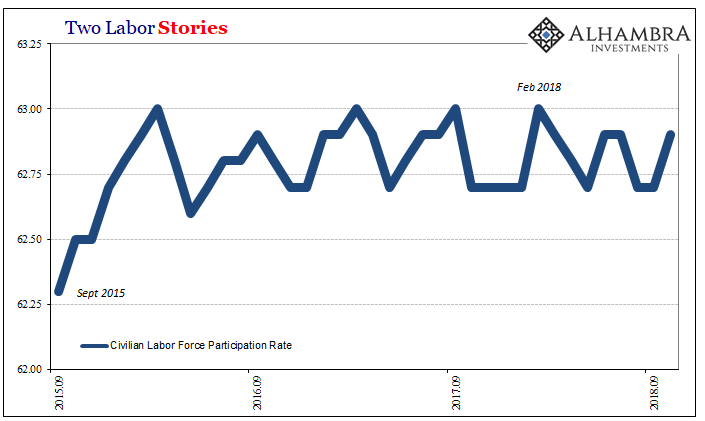
The puzzle is why it didn’t end so much earlier as everyone had forecast, even those Economists factoring Baby Boomers, labor skills, and opioids (later). For seven more years, begun by clear macro factors, current and former workers of all ages and backgrounds would continue to exit the labor market (some demographic buckets fared worse than others, obviously). It wouldn’t stop until, confusingly, September 2015.
For Yellen and FOMC officials, this was the sign those macro factors whatever might have lingered on so long had finally dissipated. For them, it was a key piece of evidence for recovery at last; their monetary policy tasks reaching completion.
But why the low in September 2015? The conventional explanation is “the best jobs market in decades”, meaning that the robust labor market of late 2014 finally proved to skeptical Americans that things really were picking up.
The problem with that view is already apparent in how the participation rate had deteriorated again while the payroll numbers were so high. There was another shot lower as workers again appeared to exit in the summer of 2015. That’s what makes this conventional view so, well, unbelievable.
We are compelled to trust that amidst growing “overseas turmoil” which saw corporate profits plummet, the labor market was just at that specific moment beginning to really cook?
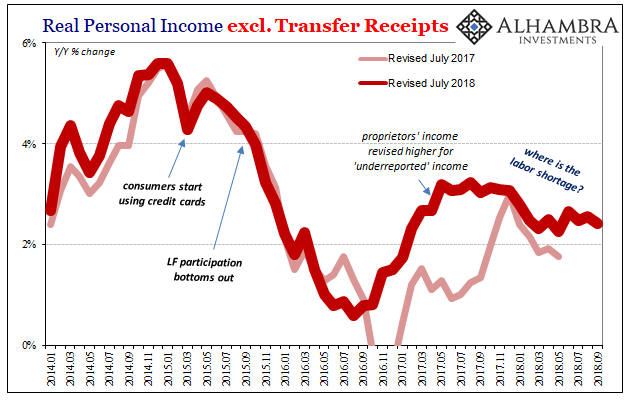
It defies all other evidence as well as common sense. Incomes, for example, which should be accelerating given that paradigm shift instead did the opposite; meaning, that incomes actually behaved as they would in and around any recession. That much is perfectly clear as is how it betrays the timing. The LF participation rate starts to mend right on the cusp of some nasty economic conditions? Doubtful.
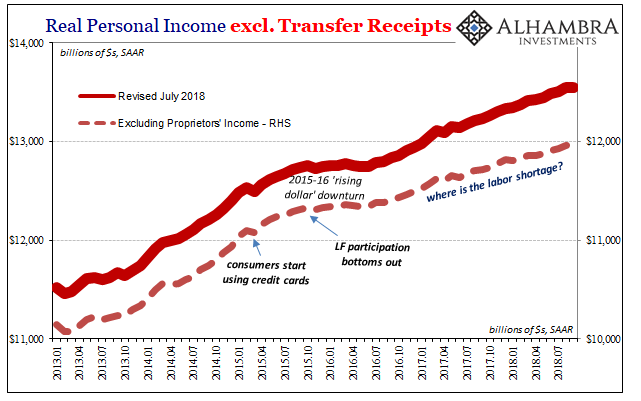
American workers had already begun turning to credit cards months earlier, which may actually have been consistent with recovery – if incomes had followed along. Instead, the sudden appeal of consumer credit therefore falls more along the lines of a last resort once overall economic conditions turned toward the uncertain.
Thus, we are left to wonder how it could be that Americans were supposedly attracted to a labor market where incomes produced within it not only stopped growing, they slowed remarkably afterward. That slowdown has continued to this day. These two accounts aren’t just uncooperative, they actually contradict one another.
Unless you consider other non-economic factors. The answer, I believe, was found in perhaps an unlikely place, one I wrote about several years ago.
What we have, then, is a statutory requirement potentially applying to millions of Americans to at least start reporting that they are working on October 1, 2015, in order to remain eligible for SNAP by January 1, 2016. The BLS’ figures for the labor force show us that starting with the month of October, the number of people in the sample who reported being both employed (HH Survey) and part of the labor force suddenly and sharply increased at exactly that moment.
The BLS statistics display what amounts to a historic rise in the official labor force during some of the worst months since 2009, the very trough of what was to be a near recession. Between September 2015 and March 2016, for six months the labor force gained nearly 2.6 million entrants. Over the six months before, including September, it had lost 54k as the economy lurched away from anticipated recovery.
Why those particular six months?
The USDA further notes that states are not required to match their re-imposition of these work requirements with calendar quarters or even fiscal federal government periods. That would suggest that some of these states may have delayed the implementation to as late as the end of Q4 last year [2015] when the 22 waivers were rescinded. That might explain why the surge in the labor force lasted six months rather than just three; staggering the timing of the start of the 3-month window across them such that the latest of the states would be reaching their work limit requirements around and in March 2016.
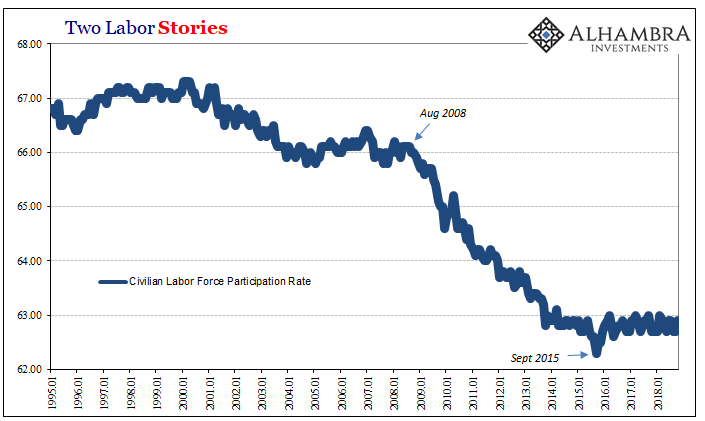
This might have meant, and still indicate, another labor statistic that was artificially inflated thus sending the wrong signal to policymakers. We bring it up today because of the return toward “overseas turmoil” that isn’t very far overseas. Since February 2018, the labor force has gained only 716k total, with 711k of those showing up in last month’s perfect payroll report. The participation rate has therefore begun to wiggle lower.
If SNAP is really the reason, or one of them, for the bottoming out of anti-participation, then what we see in the actual labor force since February could be even worse behind the estimates.
Not only that, revolving consumer credit during those same months has remained unusually weak. This is a shift from 2015, and indicates perhaps a more (economically) destructive turn.
Workers might have been OK with using credit cards in lieu of income growth in 2015 expecting that any labor market weakness might be temporary (buoyed to some extent by the constant and misguided official narrative of a coming boom). Several years later, now confronted by weakness all over again without having experienced any boom in income growth, it would make sense to this time eschew going further into debt.
Fool me once…
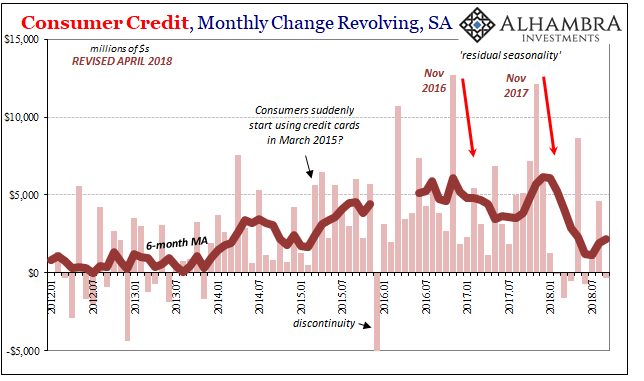
Revolving credit growth plummeted in the wake of last year’s Christmas season. With aggregate income still growing tepidly, there would be no other reason for this otherwise disparity – especially given how the labor market overall isn’t attractive to new entrants at all.
The convergence of these three trends are possible economic warnings about this “overseas turmoil”, none of which will be heeded by Jay Powell seeking to declare ultimate economic success no matter what. This is actually the data he should depend upon. It is consistent with economic trends elsewhere, everywhere really, those where it sure looks like the global economy was slammed to a standstill right when the dollar stopped falling.
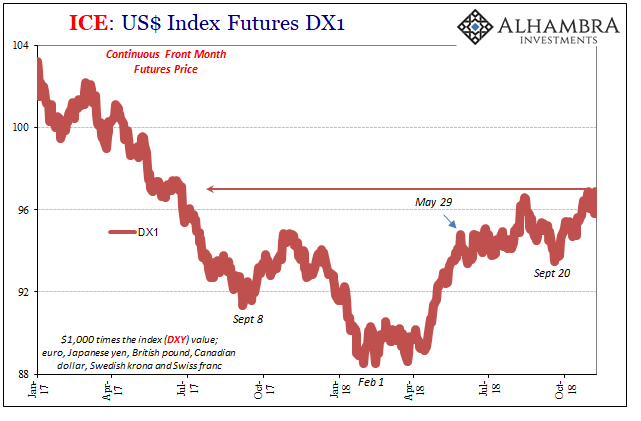
Maybe US workers understand intuitively the meaning behind the dollar, what it really represents for the labor market and economy, in a way that central bankers appear incapable. Or, US workers really have been hugely attracted to the noticeable slowdown in income.
Stay In Touch