
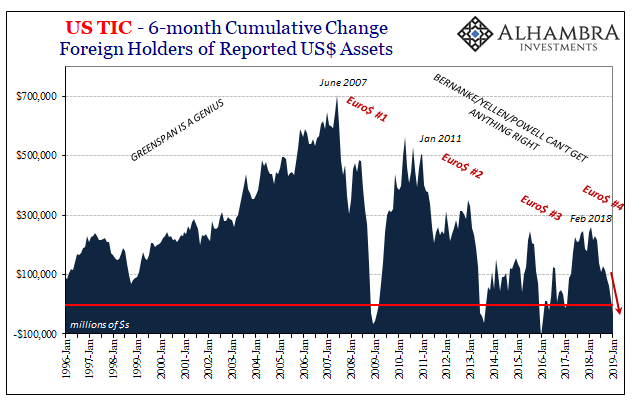
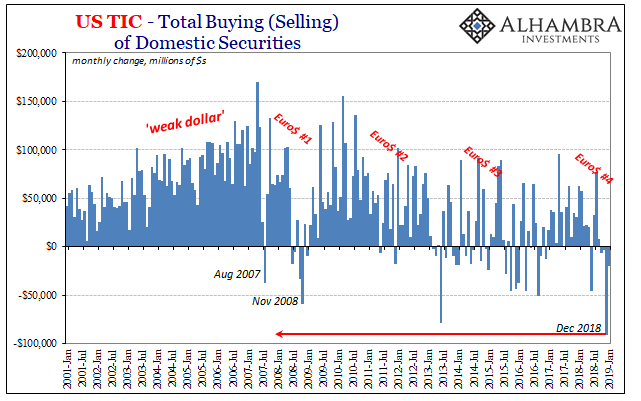
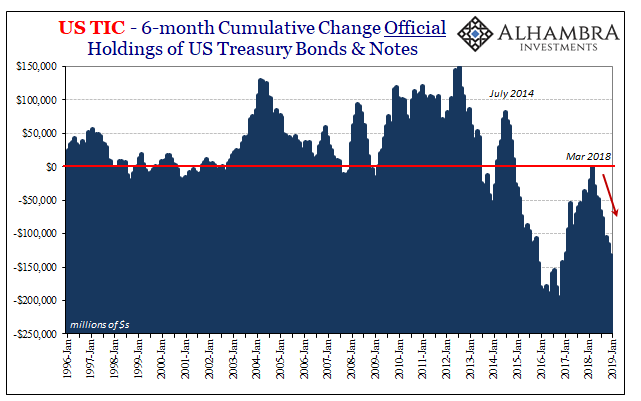
Even on a six-month cumulative basis, it is rare to find a negative number. These are reserved for the big ones, the market-shaking events that either perform an inflection or confirm one as it reaches pretty hard depths. The world being the way that it is, you just don’t see the whole forced into outright selling (on net) US$ assets.
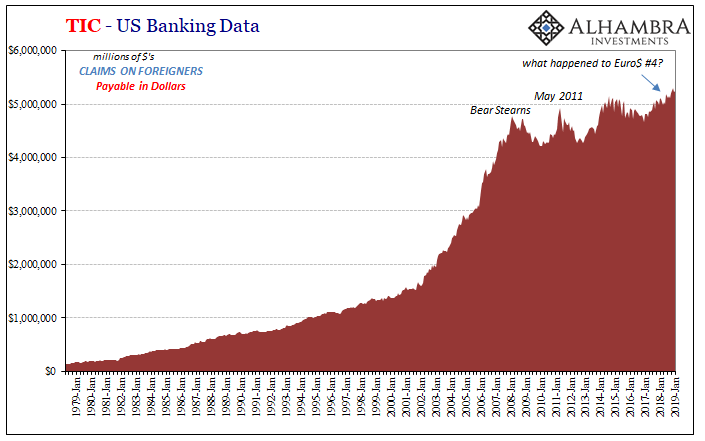
According to the Treasury Department’s TIC data, over the last six months up to and including January 2019, US banks reported that foreigners shed a net $36 billion. December 2018 was the worst month on record for this. The last time it had been this severe (6-month basis) was February 2016 (-$50.5 billion). Before that, August 2013 and January 2009. You’d have to go all the way back to May 1990 for another negative number (and it was a small one). There aren’t any others besides those in data going back to 1978, that’s how rare this is.
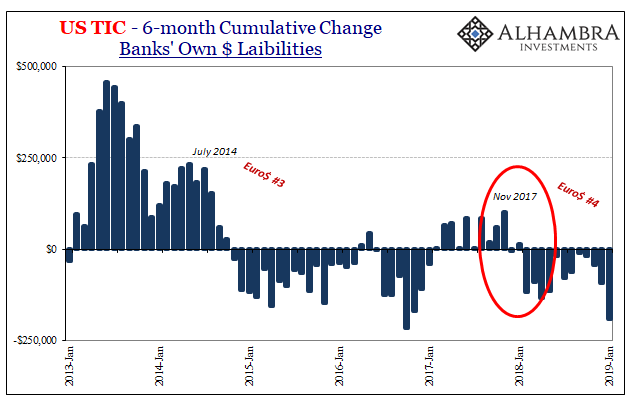
The issue remains, as always, the global banking channel. US banks and their foreign counterparts have restricted cross-border flows. This is Euro$ #4 and where it goes. In one view of TIC, total dollar liabilities reported by banks had fallen sharply in January 2019, suggesting, like curves, this market/dollar shakeup wasn’t done in December.
In terms of bank liabilities, the last six months have been among the most constrictive since August 2010 (just prior to QE2).
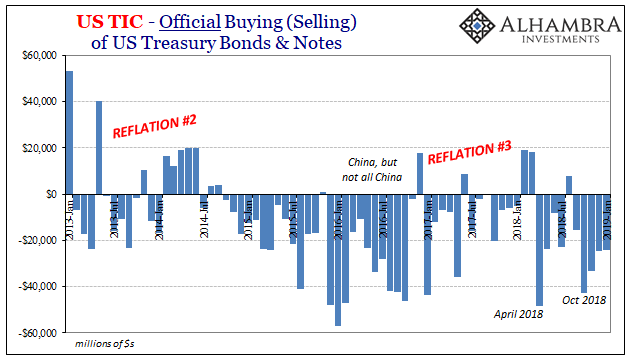
If banks aren’t supplying dollars into the eurodollar system, or at least not in sufficient quantities at reasonable terms, then you know official channels are attempting to make up (some of) the difference. The updated figures for January 2019 show another big drawdown, the fifth straight month.
Going back to last March, right when the EM crisis and rising dollar re-registered, overseas central banks and governments have been trying to fill-in the funding gaps – the dollar shortage leaving them little choice given their standing dollar short. Just like 2015, it hasn’t really worked out so well economy as well as markets.
But as all that makes good sense and continues to tell the same eurodollar story, what else might be going on out there in the hidden offshore spaces is a total mess. Officials at Treasury have been tinkering with the data, at least with what’s outside from the banking system.
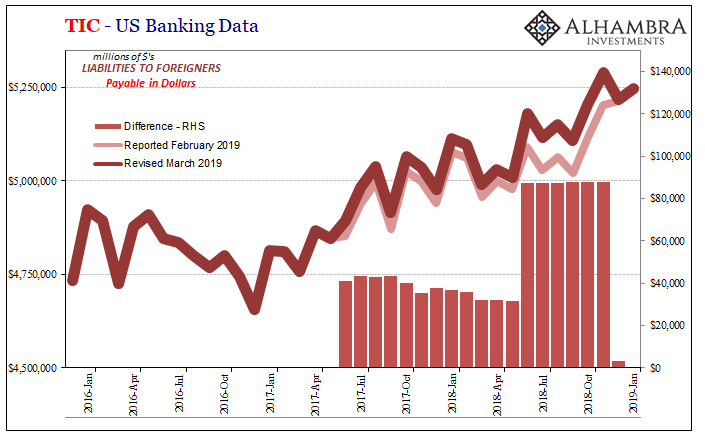
When we look at the other series on bank liabilities, both in to US banks (red) as well as out from them (blue), so far as any transactions with specifically counterparty banks are concerned the data is somewhat consistent. What happened precisely in November and December doesn’t immediately appear here, but overall since last January the data in both fits the general description.
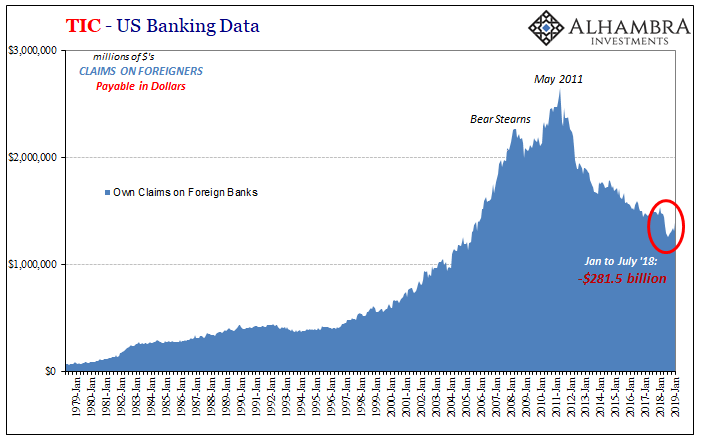
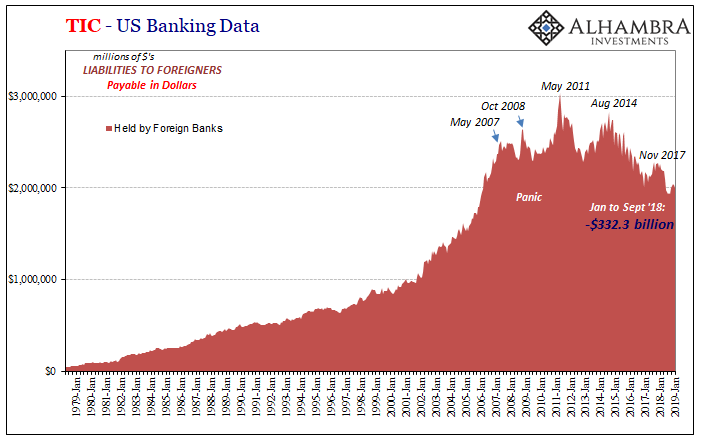
Outside of the bank channel, however, it’s a very different story especially on the “red” side where recent revisions have completely rewritten the pattern. Here’s what it looked like before November:
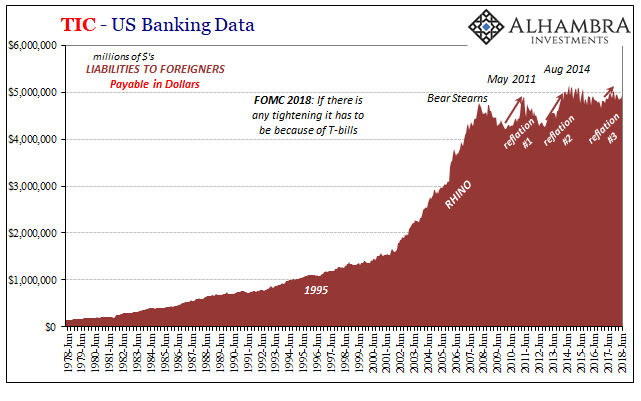
Here’s what it looks like now:
The revisions the Treasury Department has made to get from one to the other are, shall we say, interesting. In just the latest monthly update, the series released in February (for the month of December 2018) was pushed upward by what suspiciously looks like a fudge factor.
For example, the months of June, July, and August 2018 were revised upward each one by $87,468 million; the next three months, September, October, November, each by a very similar $87,663 million. Why? What?
Those were, obviously, some very crucial months given what developed during them and led us to a less-than-ideal end to 2018.
The net changes appear to pertain to European banks as well as those domiciled in the Caribbean, mostly the Cayman Islands. The Treasury Department merely mentions improved data collection relating to CLO’s, of all things, which for reasons unmentioned “the impact is noticeable for the Cayman Islands.”
It sure is, especially going back to January 2018. Is this some remnant of tax reform?
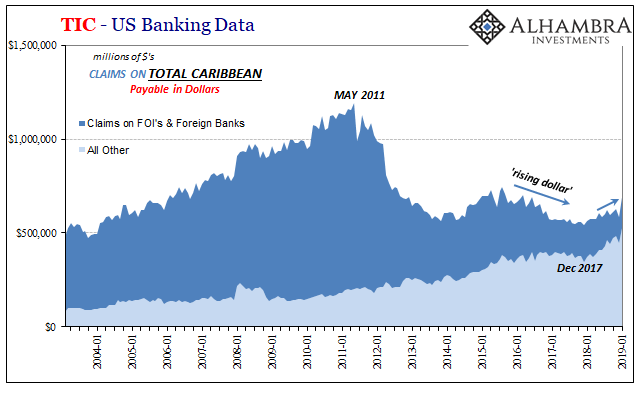
It is entirely possible, and separate from the main eurodollar bank funding issue, that tax shelters are back to redistributing US$ assets. I don’t know near enough about the tax law changes in December 2017 to support a guess, only to note the timing and how it is against the grain.
Another one that is the same way, if to a lesser extent, is Europe.
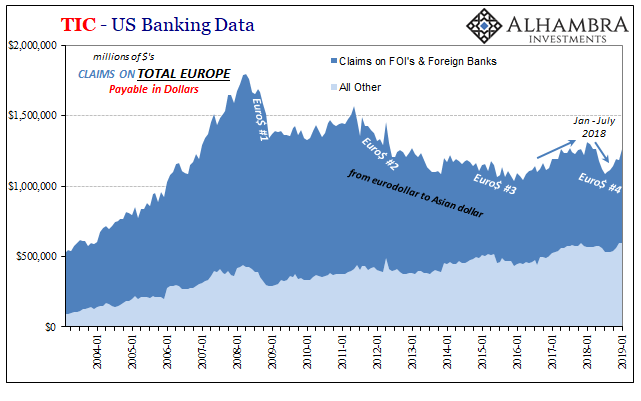
European banks acted as you would expect given the euro’s track during January to July 2018. It had been falling in line with Reflation #3 up until the end of 2017. Increasing eurodollar participation among European banks would have been consistent with a “weak” dollar especially against the euro.
This abruptly changed to start 2018, and then really reversed starting in April. The euro stopped rising also in January, and then fell quite sharply over those same several months as indicated by the TIC Europe.
Since July, the euro has been overall weaker but only slightly so. The TIC figures, cross border dollar activity with US banks, show European banks back in the mix. Where those dollars are going is anybody’s guess; they sure didn’t end up in funding markets, and it is an open question as it relates to revisions, CLO’s, and the Caymans.
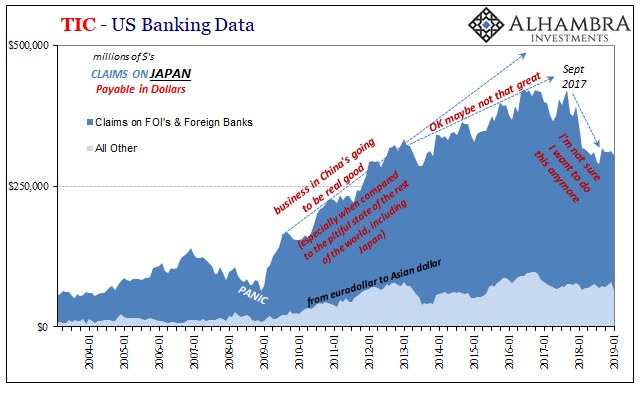
One place where there aren’t nearly as many inconsistencies is Asia. The Japanese still want little and less to do with all this redistribution business (the post-crisis Asian dollar) which has caught the rest of Asia stuck without any good answers. It is here where official “selling UST’s” is the most prevalent and not just China.
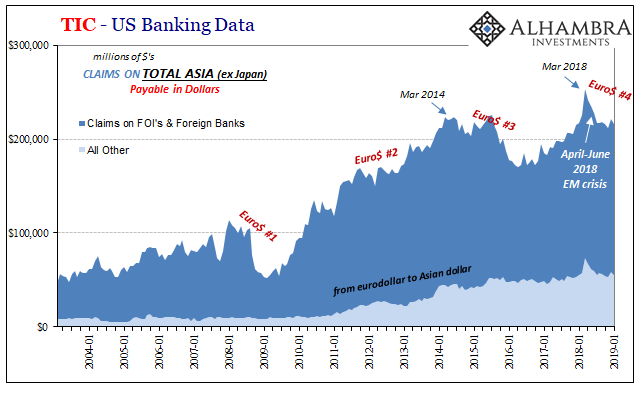
The general theme, therefore remains the same if muddied in the details: banks cut back, this Euro$ #4, funding markets go haywire (liquidity-hedged curves), and foreign central banks (try to) step in. Exactly who, and exactly what, isn’t so neat and easy. What we have in front of us is a lot about Asia, and a lot less clear about Europe.
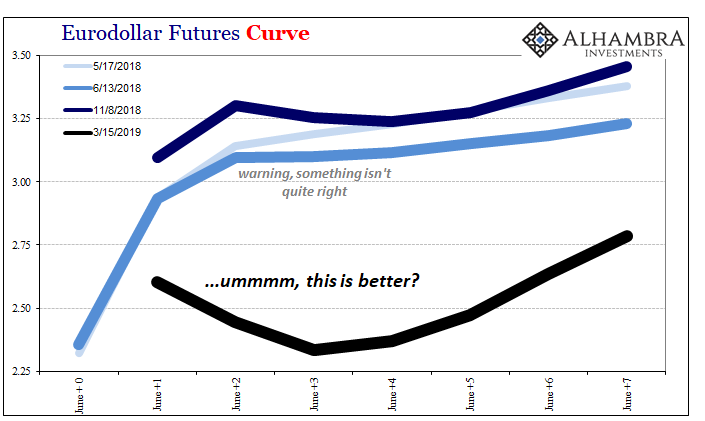
Even with CLO’s and red revisions, January doesn’t look to have been much of a real rebound. Or any, for that matter. This, too, is consistent with market prices and indications more broadly (apart from stocks). The FOMC will, in all likelihood, tell us this week that they anticipate everything going back to normal in H2 2019; rate hikes back on the table now that everything has “quieted down” at least on the NYSE.
Outside share prices, not so much. Again, a negative topline TIC number isn’t in any way a good sign. It’s not just liquidity hedging, it’s historically atypical lack of liquidity and funding.
Stay In Touch