
We’ve seen this all before. Three times. When things started to look better in the Spring of 2015, for example, “better” was more so a term of art. Another way of saying green shoots is “not as bad” or “no longer accelerating to the downside.” These have very different connotations and therefore to make an optimistic case there needs to be optimistic language.
It is harder to hate on the colorful imagery of spring.
What really happened was cycles within cycles. The “rising dollar” period then, like the Panic of 2008, was actually two parts. These eurodollar events or squeezes are big process changes. They don’t happen all at once; like trying to turn the biggest ships, it takes a lot of time and once they get going in a certain direction you can’t just turn back the other way.
Swap spreads are one way to determine which way that is. They are coincident maybe even somewhat lagging indications. As such, they give us a sense of how the weight of the system, its axis of motion might have shifted. If spreads start to compress over a long period of time, that tells us something important about the substance of balance sheet capacity; that the mighty ship has already turned in a specific direction and therefore it isn’t easily going to return to center.
Interest rate swaps (IRS) are an integral piece of the global financial system. We are taught that they are hedging instruments; and they are, sort of. However, like credit default swaps the way they are used in practice rarely conforms to the textbook examples. In college, an interest rate swap is when some real economy company somewhere wants for some reason to turn fixed borrowing costs into variable.
That does happen, occasionally, but for the most part what you need to know is that IRS is a means of controlling volatility and therefore everything that matters for a bank building out, and maintaining, its balance sheet. At this stage, I don’t want to get into any more detail than that, a topic perhaps for another day in a more advanced class in Eurodollar University.
The price of any interest rate swap is the fixed leg; if you engage in one and you agree to pay a floating rate, what fixed rate are you getting in return? In some ways, this is a synthetic repo.
We judge interest rate swaps by their price relationship to the risk-free rate. Therefore, the spread between what you can get on the fixed rate part and the comparable US Treasury note or bond. If, for example, the 10-year swap pays 2.484%, as it did a few days ago, that’s a few bps cheaper than the 10-year UST which yielded about 2.51%.
The reason swap prices are benchmarked to the risk-free UST is because there is risk involved in the swap. You have an agreement with almost always a financial counterparty to exchange cash flows over time. That counterparty can default, interest rate levels may change, the probabilities of which increase the longer you go exchanging cash flows into the future; any number of things which introduce serious risk.
Because of that, you would never engage in a risky swap if it paid less than the risk-free. Why would you? Just buy the UST outright instead, get a little better return without the risk.
Except, as you will already notice, that’s not what is happening. The 10-year swap rate is less than the yield on the same UST bond. The negative swap spread is also much larger the further down the curve you go: the 30-year IRS is paying 2.663% while the long 30-year UST bond yields 2.92%!
If you are a bank seeking to write an interest rate swap, this requires some bank capital as well as the contract conforming to several different internal “budgets” or risk metrics. It takes up some of your finite usable balance sheet space, so to speak, to engage in swap contracts (like any other asset). The longer-dated the swap, the more of that space you have to use up in order to write one (why that is, I’ll also save for another class).
Therefore, it really has to be worth your while to do the contract, the opportunity cost of using up that balance sheet space. Only, at a negative swap spread it really, really is worth your while. So, we are left to ask, where the hell are the banks who should be making a killing on this trade?
By asking ourselves this question, as a starting point, we begin to infer conditions surrounding general balance sheet capacity. That’s what the IRS curve is saying, as is the persistently negative swap spreads. It takes more balance sheet capacity at the 30s than the 10s, meaning it requires more reward for a bank to finally give up incrementally more of its precious capacity to do a 30-year than a 10-year.
What is at a premium is this balance sheet capacity.
I can already hear Erik Townsend saying to me, so what? Why should we care about how expensive it is for Wall Street speculators?
This is where the evidence becomes paramount. Look at what happens during these times when swap spreads become more negative. I’ll start with just the last two eurodollar cycles, meaning Euro$ #3 in 2014-16 (more like 2013-16) and now Euro$ #4 2018-19 (perhaps 2017- ).
A decompressing swap spread, that is, a spread that becomes less negative or more positive when compared to its reference UST yield, suggests that banks aren’t in need of more reward to write swaps. Bank balance sheets are at less of a premium which would further suggest that they are probably expanding.
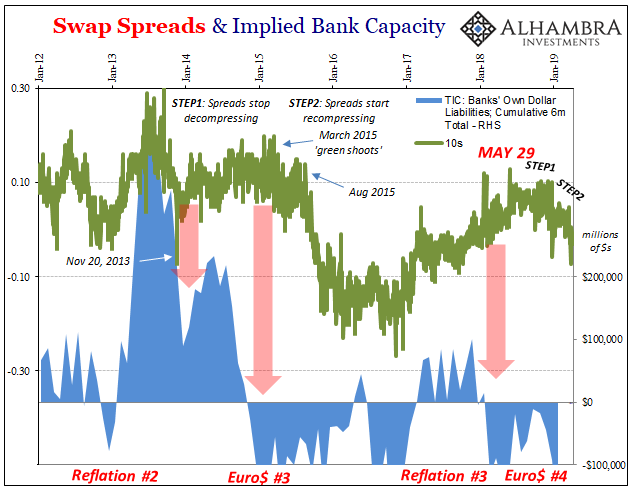
The US Treasury Department’s TIC series collects a mountain of data on the cross-border bank activities from call reports filed there. What we find in them, shown above, is that, yes, on the whole when swap spreads are decompressing cross-border US$ bank activity tends to increase. The opposite is also true, often punctuated in these eurodollar cycles.
But, like the large ship analogy, one cycle doesn’t turn onto the next cycle overnight. It takes time. In terms of spreads, at first they stop decompressing which is usually phase 1. Once they begin to really compress, dropping down to zero and below or becoming more negative, that’s when US bank cross-border dollar activity really starts to reverse (and this is where we are in 2019, toward the beginning of what looks like phase or step 2 shown above and below).
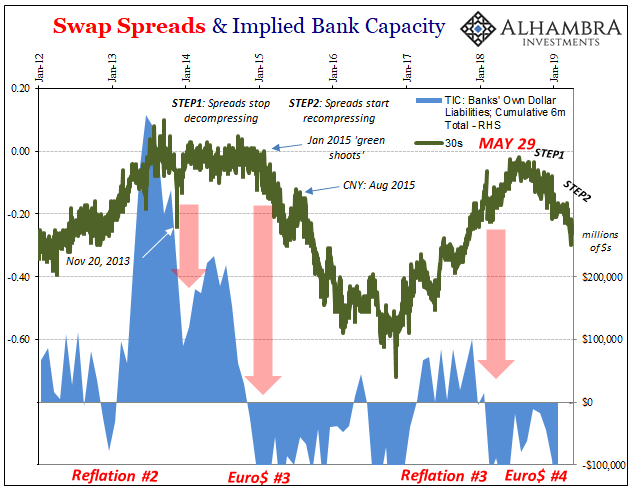
In 2015, while green shoots/growth scare cautious optimism populated the mainstream media, this shadow balance sheet stuff in real-time showed why it was a mistake. As early as January 2015, the 30-year swap spread really started to drop just as the renewable spring outlook was taking off. Maybe things did look a little better, but not for the reasons that would honestly make you optimistic.
In the shadows underneath, the world economy remained in the grip of a monetary squeeze; balance sheet capacity was increasingly at a premium (negative swap spreads) and those (euro)dollars increasingly disappeared from bank call reports compiled by TIC.
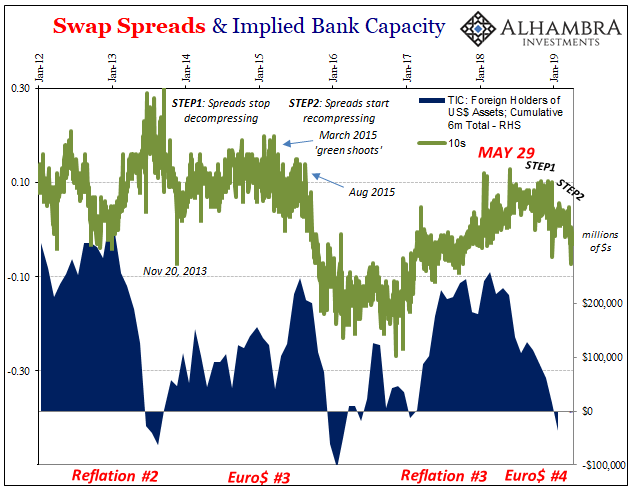
These negative effects spread across a whole range of factors. The headline TIC data, or what all foreigners are doing with their reported US$ asset holdings, not just banks, tells us that during these same periods when balance sheet capacity is at a premium foreigners tend to buy a lot less US$ assets. Not only that, during the worst parts of these squeezes they actually outright sell them.
From that correlation, we infer another element to the eurodollar problem. The world needs dollars for the purposes of a global reserve currency. It gets them from this eurodollar system, the dollar short, therefore if it can’t find them easily in that system you do what you have to as a bypass; including the sale of US$ “reserves.”
We also find that coincident to these more global effects, when balance sheet capacity is at a premium (shortage) money market hierarchy breaks down. A secured interbank borrowing rate should not be above an unsecured one. Like a negative swap spread, this is upside down in terms of textbook risk.
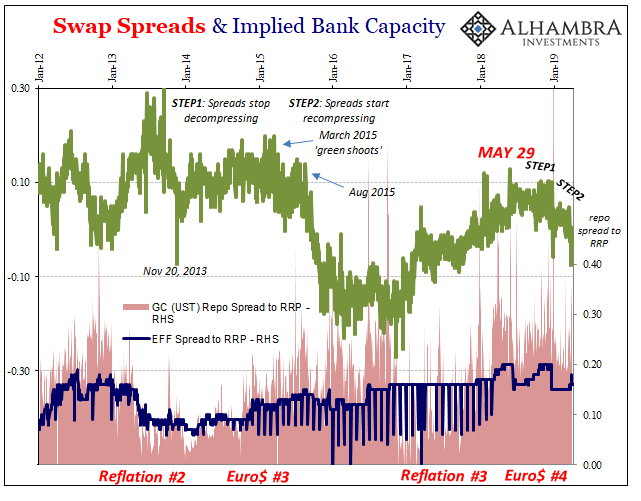
And yet, there it is in two different sets of real-time market data – playing havoc even as far as the irrelevant federal funds market. Not only does it happen, this condition persists! More importantly, look when it persists: balance sheet shortage.
Though we cannot observe the eurodollar directly, this credit-based, bank-centric system located out there in the shadows, it makes itself known in any number of different ways. We can observe those, leaving for us “only” the job of interpretation.
Stay In Touch