
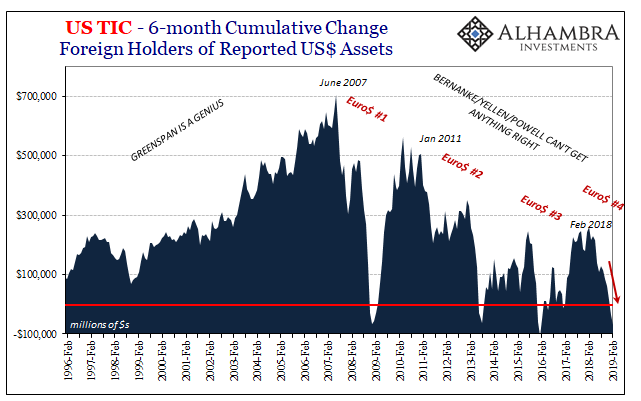
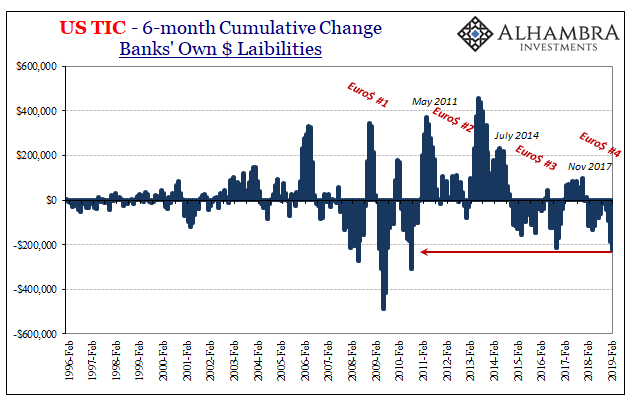
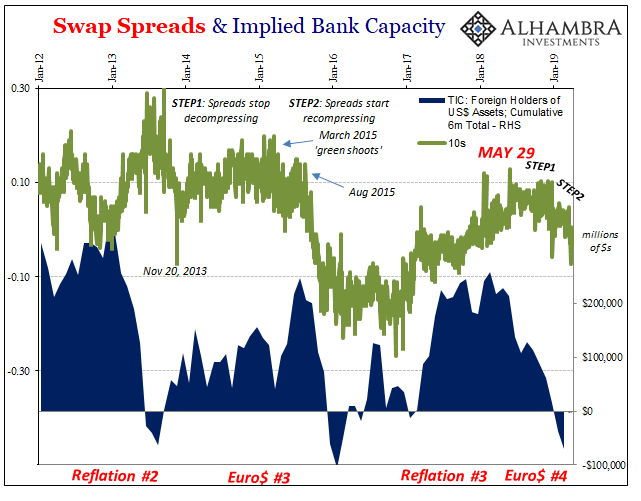
The rest of the TIC data was relatively straightforward, at least in viewing it as a proxy for monetary conditions offshore (spilling over, as EFF, onshore). Through February 2019, the usual: shortage of balance sheet capacity, banks cutting back cross-border US$ liabilities (except for resales), foreigners selling US$ assets as a consequence. The official sector selling the most and most continuously.
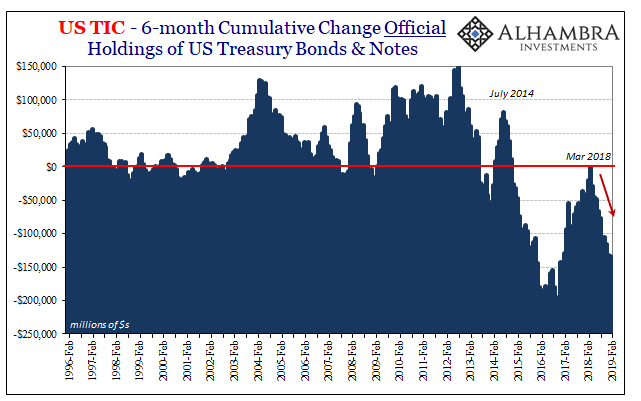
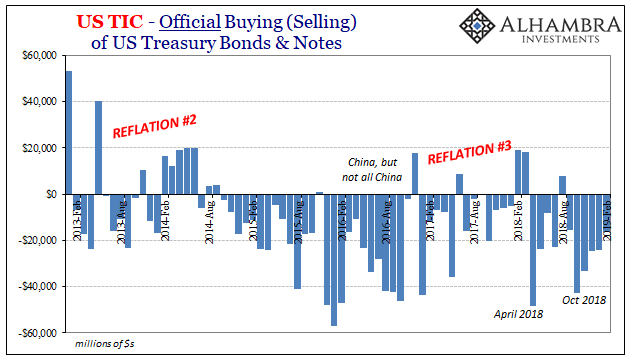
It is worth noting that the past six months have, according to the TIC figures, been among the worst in the series. The most selling, suggesting at the very least a pretty severe degree of global monetary tightening even two months into 2019.
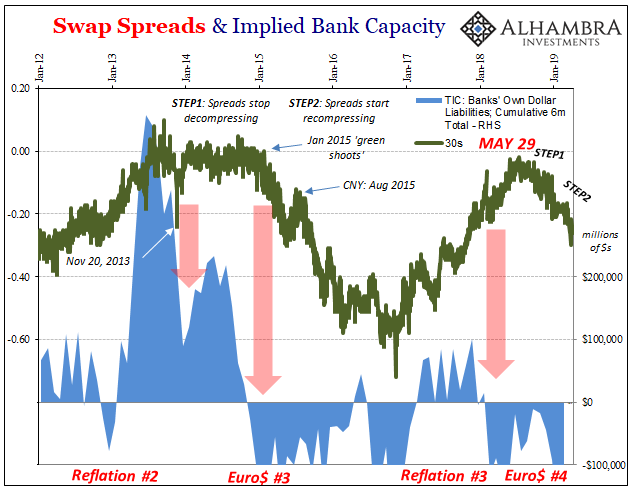
On a cumulative basis, 6-month totals, overall selling is nearly as much as the worst of 2015-16. In terms of bank liabilities, you have to go back to August 2010 (just before QE2) to find banks cutting back more.
Unfortunately, TIC can only help determine what was, not what’s next. Is Euro$ #4 just getting started, or, like green shoots, is that the worst of it?
One key will certainly be China. It’s been very quiet on that side of the Pacific for several months now, which, I think, is entirely the point. CNY since the end of January has been almost pegged at around 6.71 (feeling a bit like early to mid-2015). In the TIC data, the Chinese haven’t been “selling” all that much of their reserves. Yet, the PBOC has done 5 RRR cuts and scaled back their own RMB bank reserves for something.
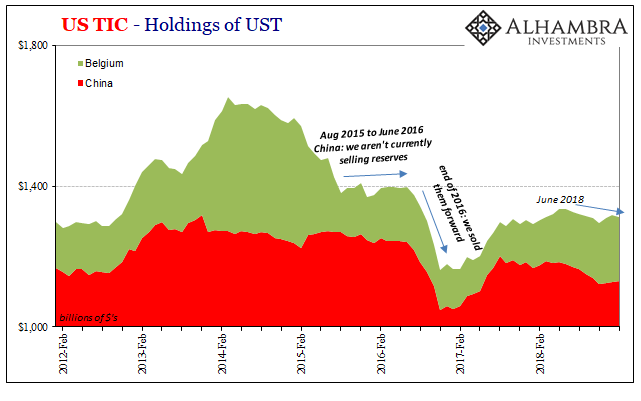
In other words, is there a point at which keeping CNY steady using almost certainly swaps and term repos (future “selling”) becomes too expensive for the effort? Like 2015-16, the second half of 2016 the Chinese finally ponied up for everything they had tried during Euro$ #3. CNY sank to 7.0 and was only saved, if you want to think of it that way, by Hong Kong.
Again, TIC doesn’t tell us what the Chinese will do, only what little they’ve done so far out in the open. The rest is inference and speculation until, like during March, markets confirm (or deny) this thing is still ongoing.
Stay In Touch