
Nothing will ever compare to China’s New Year Golden Week holiday for challenging economic statistics. Since the celebrations are not affixed to a specific point on the calendar, floating around back and forth some years between January and February, it makes making comparisons of those months particularly tricky.
For the China’s Big 3 statistics, industrial production, retail sales, and fixed asset investment, Chinese authorities don’t bother trying. They wisely just combine the two months together.
Over here, in US and elsewhere we can experience similar holiday-induced problems around Easter though nowhere to that extent. This year is one year when that will be the case. The holiday itself fell on April 1 last year, which for consumer spending supposedly meant an uptick in activity related to it over the last few weeks in March 2018.
In 2019, obviously, Easter Sunday is this coming weekend. Therefore, the holiday rush, such that there is any such thing, would’ve happened entirely within April. Does that mean we should adjust something like March retail sales to account for the difference?
The Census Bureau believes so. And they did. Seasonally-adjusting data means making statistical imputations beyond those based on inherent differences among the calendar months. As every retail sales press release says, that part of the data is “adjusted for seasonal variation and holiday and trading-day differences, but not for price changes.”
The adjusted number for March suggests retail sales rebounded from a drop in February. Maybe even a large comeback. Month-over-month the increase was 1.4%. On a year-over-year basis, retail sales rose 3.6%. The latter figure isn’t a very good one. In fact, near to 3% it is actually pretty bad for an annual rate.
Unadjusted, however, retail sales were up 1.5% year-over-year in March. That’s downright atrocious. The Census Bureau clearly believes about 2 percentage points disappeared into April due to the later arrival of Easter. Surprising no one, I don’t believe that’s the case.
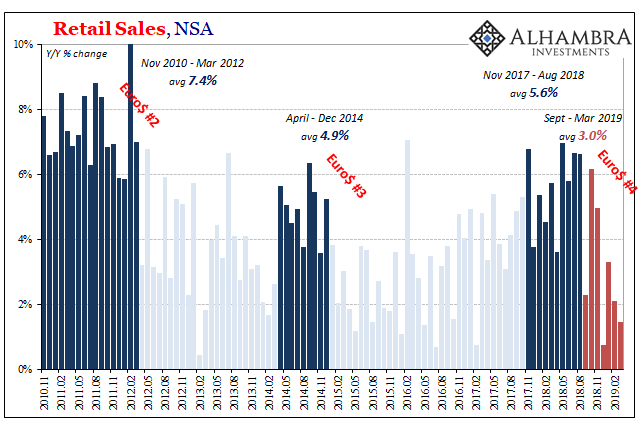
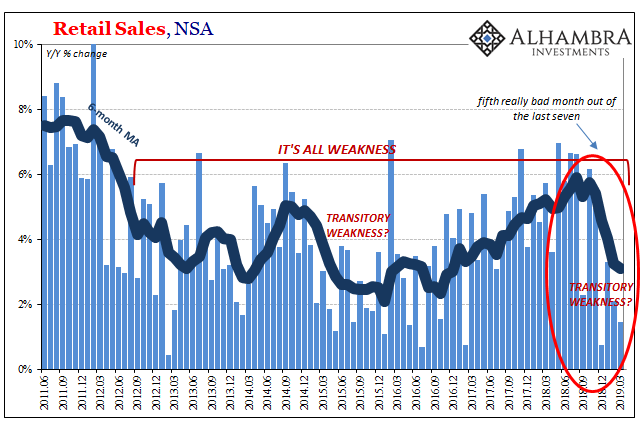
March unadjusted makes the fourth consecutive really bad month for retail sales, all of them aligning with market chaos and curve inversions. As pictured above, economic weakness is becoming more prevalent, not less. That’s five really bad months out of the last seven, suggesting, strongly, there is more than statistics to consider when considering March retail sales.
As a reminder, 6% during an actual economic boom used to be concerning. Three percent has been consistent with mild recession (as in 2001 or the first part of the Great “Recession”). The average as of this update for March is 3.12%. Even if we use the seasonally-adjusted 3.6% for last month, it only changes the average to 3.47%. Splitting hairs, perhaps, about the right color of awful.
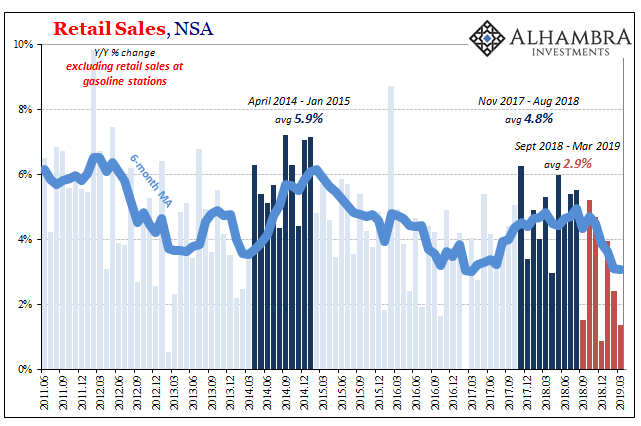
Excluding gasoline or focusing in on retail sales without the auto sector, there are no differences among the component classes. This is broad-based weakness. What is perfectly clear is that the US economy has materially slowed since around last summer.
Using that seasonally-adjusted data, even with March’s jump the trend is the same. The calculations change only a little as each month is either up or down from the preceding one.
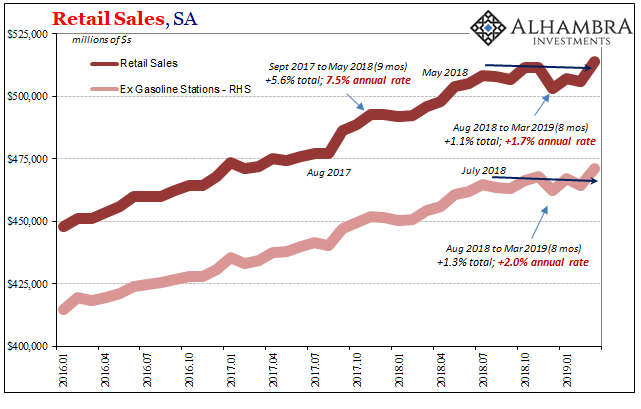
Including Census’ Easter fine-tuning, retail sales since last July (meaning August to March) are up just 1.1%, an annual rate of less than 2%. Excluding gasoline (spending at gasoline stations was actually higher in March 2019 than March 2018) retail sales are up just 1.3% in those eight months. These are, again, really bad results which now span two-thirds of a year.
The issue, therefore, isn’t really the calendar. It is about green shoots. Thinking about it in those terms, does March’s seasonally-adjusted estimate mark the beginning of economic acceleration, at least the end of a temporary “growth scare?” Or, unadjusted, does another sub-3% month, the fourth straight, confirm that something is really wrong with the US economy?
Looking at it this way, the only times you ever see the average figure drop almost straight down like it has since last summer are those when some form of downturn is ahead. Essentially, it’s one month of questionable calendar effects versus two-thirds of a year that can’t be anything other than macro.
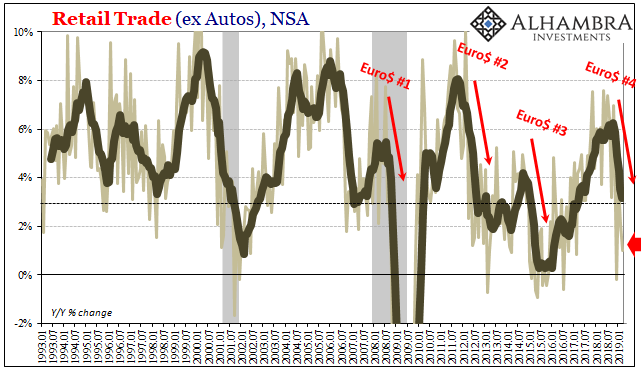
The final determination isn’t going to be made off retail sales data alone. And that’s where the concern should lie about green shoots. Those five really bad months shown on the chart immediately above correspond back to October 2018. In other words, the same exact time-frame as when market chaos erupted. The US economy, as others around the world, really appears to have struck a (Euro$) landmine in that window.
Maybe the Fed “pause” needs a little more time to show up, but even as bond markets have retraced in April they haven’t gone all that far. It’s funny how when curves rebound after plummeting the rebound in them is suggested as consistent with green shoots (whereas the plummet is “mispriced”). On the contrary, there is no sign of benefit from a Fed pause in them recently.
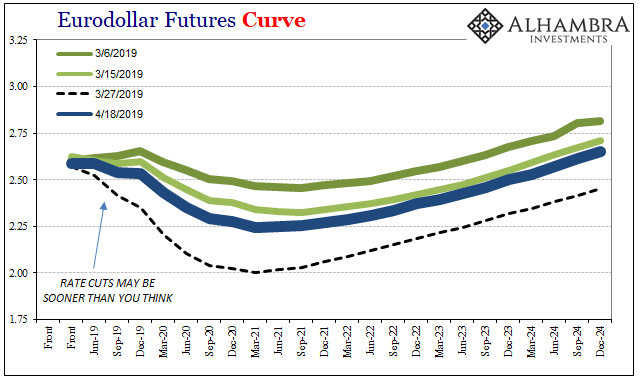
Eurodollar futures, for instance, have retraced only to around mid-March; or mid-plummet, if you will. What that means is the market still expects this something, whatever that something is, only in April it may not be as close to the visible horizon as priced in March. It’s still there, but perhaps not quite as imminent.
Either way, the retail sales figures even with their Easter modifications are alarmingly consistent with curve behavior. Now with offshore collateral concerns back in play (gold of late), that’s not a good place to be for the global economy moving ahead. In other words, less calendar questions, more market-to-macro consistency.
Stay In Touch