
Revisions to second quarter GDP were exceedingly small. The BEA reduced the estimate by a little less than $800 million out of nearly $20 trillion (seasonally-adjusted annual rate). The growth rate therefore declined from 2.03502% (continuously compounded annual rate) to 2.01824%.
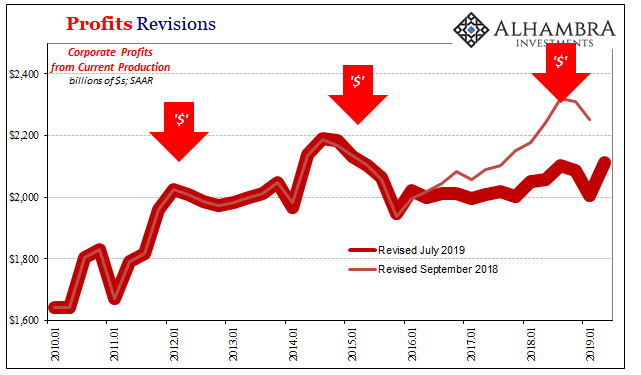
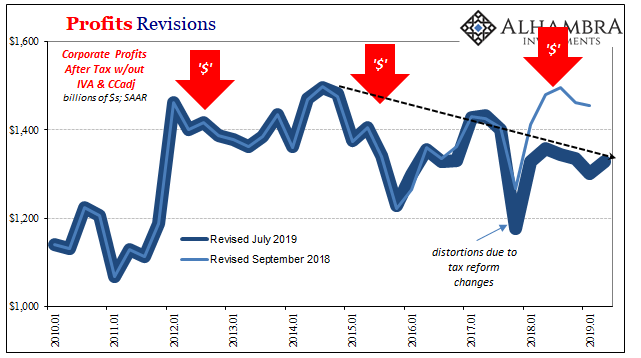
The release also gave us the first look at second quarter corporate profits. Like the headline GDP revisions, there wasn’t really much to them. At least not when viewed in isolation. Across the series, profits were up in Q2 after being down in Q1. The amount differed depending upon the definition, but overall it wouldn’t be classified as a rebound.
In other words, corporate profits were largely unchanged for the first half of 2019. Already, that’s not good.
As noted not that long ago, benchmark revisions had shaved a significant amount from them to begin with. The corporate situation is therefore wildly out of tune with anything like a strong economy. In fact, the new benchmark data and even the latest estimates for the second quarter finally suggest the background behind the BLS’ recent revisions to the labor market data.
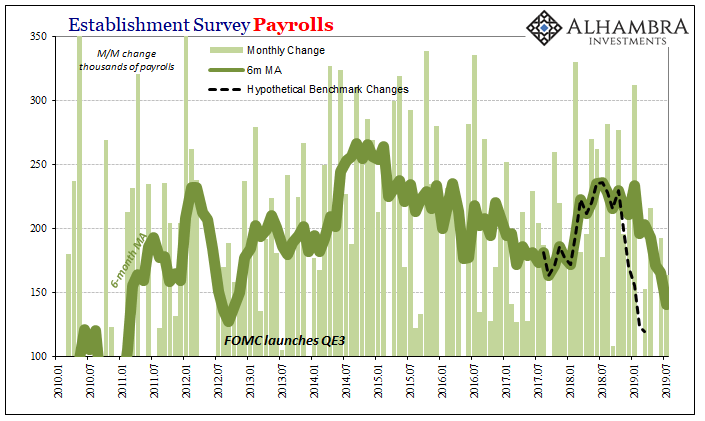
Though they are come from different government agencies and there is no numerical means to tie them together, when the BLS went to check on its Establishment Survey figures for the month of March 2019 it found half a million fewer new payrolls added – about one-fifth of the prior annual increase previously estimated. That’s a pretty strong intuitive link to the likely shape of corporate bottom lines.
This suggests very likely a clear slowdown in hiring and additions to business staffing beyond what those initial estimates had already figured. I wrote last week:
I suspect that what the BLS will find is how the Establishment Survey actually picked up the landmine which registers everywhere else – including what’s already in the preliminary estimates from the Household Survey. The lower tax numbers in March 2019 probably resulted from a much weaker economy between October 2018 and then.
In other words, I’m guessing that the substantially lower number the BLS found using the March 2019 unemployment filings arrived there because the labor market really turned sour closer to the end of 2018 than perhaps all throughout last year.
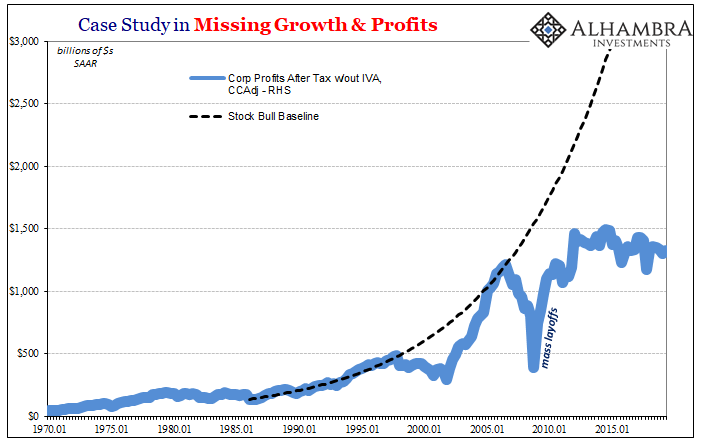
What that might propose as far as the BEA and its corporate profit numbers are concerned, if they are slightly better in Q2 than Q1 it would be because businesses have adjusted to trimming costs. Not outright dismissals and mass layoffs, rather by hiring and expanding significantly less than otherwise.
Over-managing the cost structure. Profit growth in an otherwise healthy economy should come organically from business expansion, from the top line down. As in 2009, when profit growth is instead derived the other way from the bottom up that’s never a good sign.
It shows that businesses are already making adjustments because they are already thinking the environment (slowdown/downturn) is not as likely to be “transitory.”
With very good reason, as the BEA’s last benchmark assessments revealed. For all the constant talk of an economic boom and a strong background environment for the labor market, a real one is such that companies make a lot of money (profit growth) and it becomes sustainable when they share them with their workers. That’s supposed to be the beauty of capitalism; everyone wins.
If it doesn’t seem like it’s been that way in a very long time, as I pointed out yesterday, it’s because this economy has never pulled out of the condition in which everyone loses – business first.
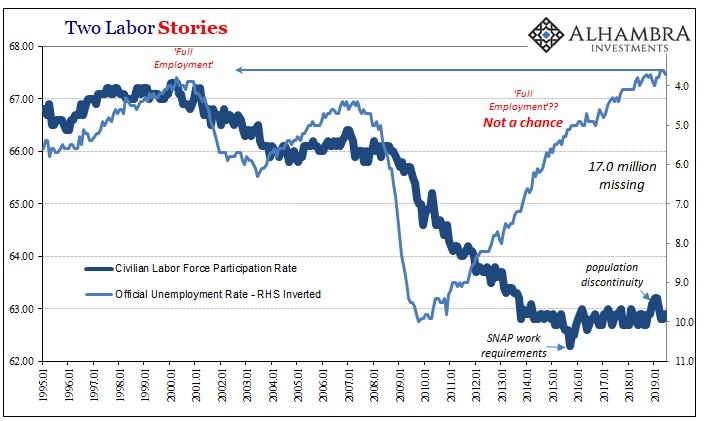
Why has there been a participation problem? What has kept wage gains to a minimum despite the lowest unemployment rate in 50 years?
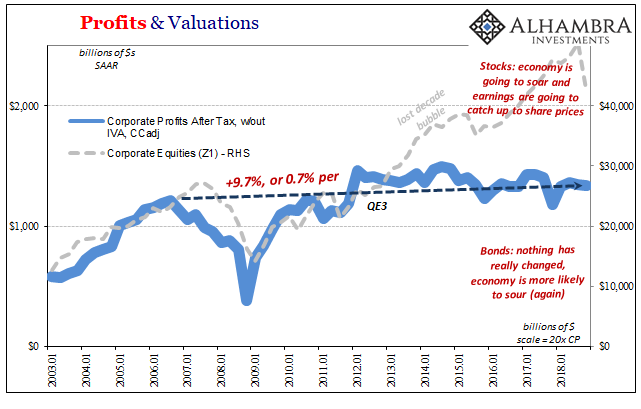
An absolutely dreadful business environment. The BEA’s numbers are simply staggering. Since the last “business cycle” peak in profits nearly fourteen years ago, after tax net income (adjusting for other non-cash add-ons) is up a grand total of 9.7%. Not even double digits for almost a decade and a half. That works out to less than 1% per year.
Economists at the Fed keep talking about R* and how it must be drug addicts, retiring Baby Boomers, and lazy Americans who won’t go back to college who must collectively be responsible for the labor market and therefore the economy. There’s no need to be so fantastically creative; the answer is right here.
And that’s exactly why no central banker will talk about profits; they are an indictment of recovery policies (macro, not structural). Companies haven’t experienced any sort of boom and therefore have consistently held the line on costs; which only reinforces the labor problem (macro slack) and keeps the entire vicious cycle in place.
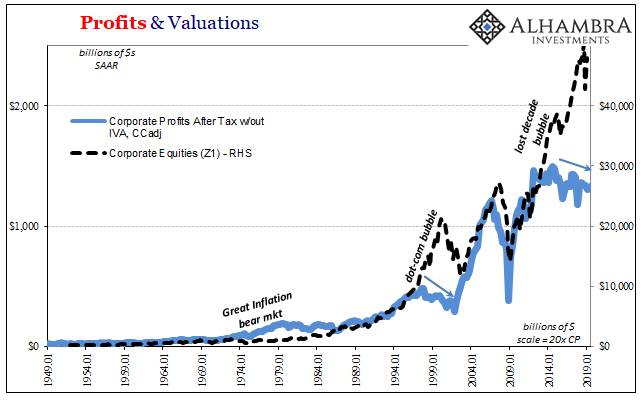
The reason? Again, look at the profit charts. Typical recovery processes require sustained recovery conditions. The one which developed following the Great “Recession” was immediately stunted (liquidity) and then entirely aborted after 2011 (a near repeat of 2008). That’s why all the profit data uniformly points to Q1 2012 as effectively the end of any recovery.
The 2011 crisis led to the 2012 slowdown from which no one has escaped. Instead, more and more of the world has been caught up in it (China, EM’s) as time has progressed.
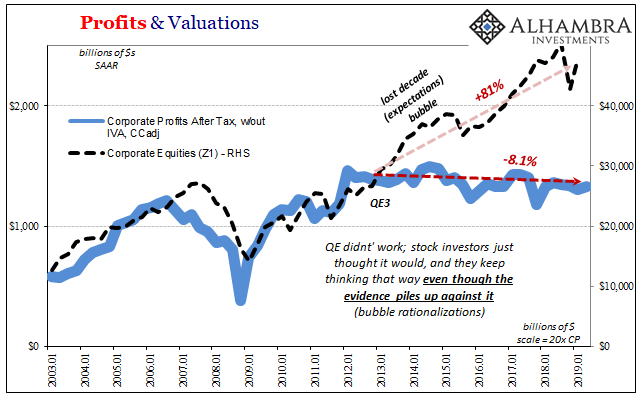
The implications, of course, are not limited to this chronic economic dysfunction. The divergence between share prices and earnings has been more and more provocative ever since QE3 was announced in September 2012. Just as the economy was settling into its malaise, stock investors got the impression it was going to recover (who gave them that idea?)
Since then, stocks are up 81% (only through Q1 2019, which is the latest estimate in Z1; meaning that when the Q2 estimates come out it’s almost certain that share prices are up closer to 100%) while earnings are down more than 8% in the same exact timeframe.
Shareholders have been willing to pay exorbitant values first for the minor macro uptick in 2014 (Reflation #2) which was translated on Wall Street as proof QE3 (and 4) was working as designed. It was perhaps the greatest and most sustained head-fake of all time.
Since then, the abrupt interruption of Euro$ #3 in 2014 and 2015 which had ended the small profit contributions of Reflation #2 had first been rationalized away as “transitory” factors – which was then taken as established by Reflation #3’s big bumper sticker slogan “globally synchronized growth.” Prices diverged still further.
The benchmark revisions taking away so much profit growth are more in line with the behavior of businesses during what was supposed to have been the big boom. Data like non-residential construction spending showed that if the economy was truly taking off companies sure weren’t building like they saw it that way. In light of profit revisions, the distinct lack of capex makes perfect sense.
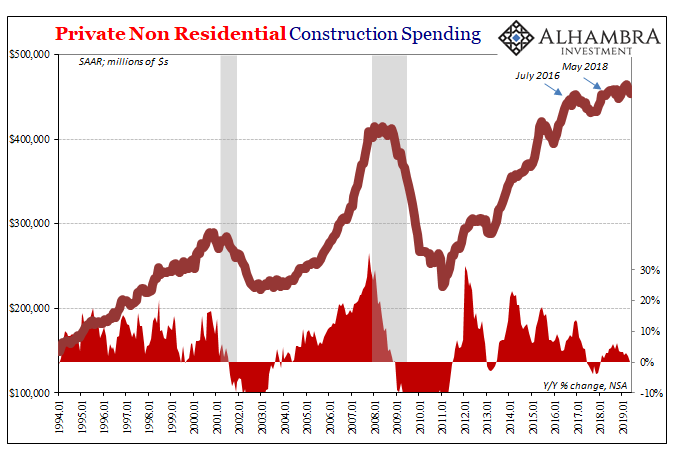
Without profits, there can be no recovery let alone a big boom. That’s why businesses weren’t building as if there was one – because from what they were seeing top to bottom on their income statement there wasn’t. In 2016, they shut down what little additional construction and productive investment there had been after experiencing Euro$ #3’s “profit recession” simply because profits never came back from it.
The stock markets have justified valuations as a product of time, when in fact time has only proven there is no justification for valuations. And that was all before Euro$ #4.
Stay In Touch